146 E1.09: Section 6 Part 1
Section 6. Explore how the graphs of formulas change as the parameters change.
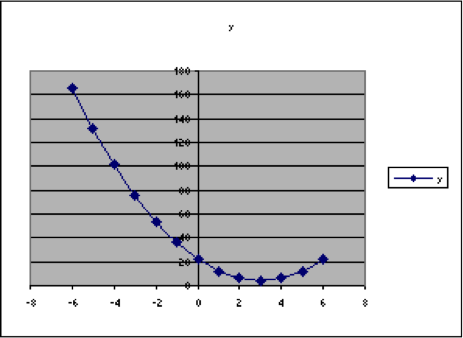
Example 20. Consider this formula [latex]y=a{{(x-h)}^{2}}+k[/latex], which is a generalization of the formula we have graphed in several examples in this topic. That example is[latex]y=4+2{{(x-3)}^{2}}=2{{(x-3)}^{2}}+4[/latex], so there [latex]a=2[/latex], [latex]h=3[/latex], and [latex]k=4[/latex]. In this section, we will use the spreadsheet to graph this in a way that will make it easy to explore what happens when we change one or more of (which we call parameters.)
Setting up the spreadsheet:
- We will graph this for values of x from -6 to +6. So put the label x in cell A1 and then start in A2 with these values and continue through A14.
- Instead of putting the formula directly into column B, we will enter the three initial values [latex]a=2[/latex], [latex]h=3[/latex], and [latex]k=4[/latex] in cells over to the side. Please put the values in column G, cells G2, G3, and G4, respectively and the labels in column H.
- Label column B as y. That is, enter y into cell B1. Then enter the formula in cell B2. Notice that the cell references for a, h, and k must be entered with absolute references, so the formula that would have been =2*(A2-3)^2+4 is, instead =$G$2*(A2-$G$3)^2+$G$4
- When this is entered correctly, the numerical value will be 166.
- After the formula is entered correctly, then copy and paste it into the remainder of the cells in column B, which is through B14.
- Then select the data, with the labels. Highlight it. Then choose Insert > Chart and XY Scatter. Choose one of the options that connects the data with curves. Then keep clicking on “Next” until you click on “Finish.” This will produce a graph of the formula with the given values in it.
| A | B | C | D | E | F | G | H | |
| 1 | x | y | ||||||
| 2 | -6 | 166 | 2 | a | ||||
| 3 | -5 | 132 | 3 | h | ||||
| 4 | -4 | 102 | 4 | k | ||||
| 5 | -3 | 76 | ||||||
| 6 | -2 | 54 | ||||||
| 7 | -1 | 36 | ||||||
| 8 | 0 | 22 | ||||||
| 9 | 1 | 12 | ||||||
| 10 | 2 | 6 | ||||||
| 11 | 3 | 4 | ||||||
| 12 | 4 | 6 | ||||||
| 13 | 5 | 12 | ||||||
| 14 | 6 | 22 | ||||||
| 15 |