
80 G1.05: Exploring by Graphing Part I
Section 2. Exploration by graphing.
We can also find lines just by graphing. That may be useful itself in some situations even without finding the actual equation of the line. And, if we have already found the equation of the line, we can use a graph to check our algebra.
We have considered two types of problems in this topic.
The first is finding a line when we have the slope and one point on the line. To graph that by hand
- Make a set of axes.
- Graph the point.
- Rewrite the slope as [latex]\frac{\text{rise}}{\text{run}}[/latex] and use that count over and up (or down) to make another point on the graph.
- Connect those points by a line.
The second case is finding a line when we have two points on the graph. To graph that by hand
- Make a set of axes.
- Graph one point.
- Graph the other point.
- Connect those points by a line.
In either of these cases, after we have the graph of a line, we can pick any point on that line and know it is supposed to fit the equation of the line. So we can plug in the values for x and y into the algebraic formula we found. If the graph is correct and the equation is correct, then the point will fit the equation.
Using a spreadsheet to graph lines allows us to try various possibilities quickly and easily. The interesting case here is when we have two points and we want to explore various possible equations of a line.
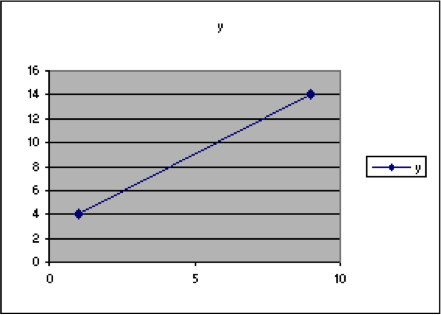
Example 15. Use a spreadsheet to graph the line through the points (1,9) and (4,14).
- Put the label x in cell A1 and enter the x-values: A2 should have 1 and A3 should have 4.
- Put the label y in cell B1 and enter the y-values: B2 should have 9 and B3 should have 14.
- Then select the data, with the labels. Highlight it. Then choose Insert > Chart and XY Scatter. Choose one of the options that connects the data with curves. Then click on “Next”. In this box, check the “Columns” box to indicate that the data is arranged with the data values in columns. This is a VERY IMPORTANT step when you are only dealing with two points. This step should not be necessary when you have more than two points.
| A | B | C | D | E | F | G | |
| 1 | x | y | |||||
| 2 | 1 | 4 | |||||
| 3 | 9 | 14 | |||||
| 4 | |||||||
| 5 | |||||||
| 6 | |||||||
| 7 | |||||||
| 8 | |||||||
| 9 | |||||||
| 10 | |||||||
| 11 | |||||||
| 12 | |||||||
| 13 | |||||||
| 14 | |||||||
| 15 | |||||||
| 16 | |||||||
| 17 | |||||||
| 18 |
