
115 I1.07: Section 5 Part 1
Section 5: Using Models.xls to find a quadratic model
|
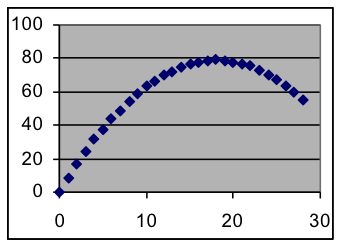
If we wish to find a model for the data on the right, this quick scatter plot of the data shows that a straight line will not be sufficient. Such parabolic shapes (similar to the path of a thrown ball) is instead represented mathematically by a quadratic formula, in which the term that contains the input variable x is squared.
There are several ways to write a quadratic formula, all of which can make the same curves. For use in fitting data, the best kind of quadratic formula is y = a (x – h) 2 + v, where the parameters h and v are the x and y coordinates of the vertex of the parabola (that is, its highest or lowest point), and a is a “shape” parameter that determines how sharply (and in which direction) the parabola bends. The quadratic formula pattern that is most convenient for fitting models: [latex]y=a\cdot{{(x-h)}^{2}}+v[/latex] a is a “shape” parameter controlling how much (and in which direction) the parabola bends h is the x coordinate of the vertex (its horizontal distance from the origin) v is the y coordinate of the vertex (its vertical distance from the origin) Examples: [latex]y=3\cdot{{(x-2)}^{2}}+8[/latex] [latex]y=2.5\cdot{{(x-7)}^{2}}-33.4[/latex] [latex]y=-2\cdot{{(x+3.5)}^{2}}+37[/latex]
|
|
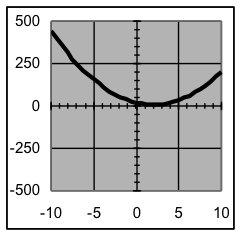
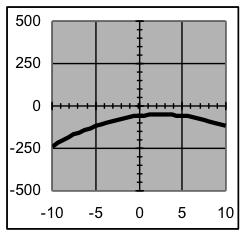
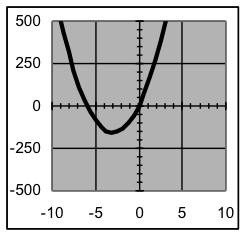
| Examples of graphs of various quadratic formulas | |||
|---|---|---|---|
 |
 |
 |
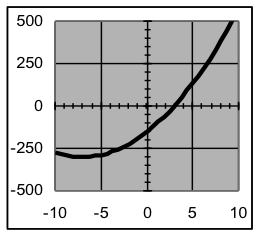 |
| [latex]y=3\cdot{{(x-2)}^{2}}+8[/latex] | [latex]y=-1.2\cdot{{(x-2.5)}^{2}}-50[/latex] | [latex]y=18\cdot{{(x+3)}^{2}}-158[/latex] | [latex]y=3\cdot{{(x+7)}^{2}}-300[/latex] |
Example 5: For each of the formulas above, state the location of the vertex of the parabola formed.
Solution: Since the vertex is at (h,v) when a formula is expressed in the form, the coordinates for the vertices are: (2, 8) (2.5, −50) (−3, −158) (−7, −300)
Note that the sign of the x vertex coordinate is the opposite of the sign that the same number has in the formula, since the h value is subtracted when forming the formula.
Quadratic models are somewhat more complicated than linear ones, as is indicated by the fact that a quadratic model has three parameters instead of two. But there is really very little difference in the fitting process from what is done for straight lines: [1] put the data in the appropriate worksheet, [2] spread the C3:E3 formulas down beside the data, [3] make a graph and adjust the vertex (instead of the intercept) and the shape (instead of the slope) until the model and the data match, and [5] write down the formula or use it to predict any values you have been asked for.
