
125 J1.06: Section 2 Part 1
Section 2: Comparison of different models for the same data
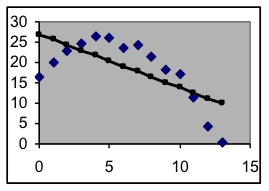
This graph and its residual values below both show that even the best linear model fits this data poorly.
| x | y | model | deviation |
| 0 | 16.6 | 26.891 | -10.322 |
| 1 | 20.2 | 25.586 | -5.432 |
| 2 | 23.0 | 24.280 | -1.279 |
| 3 | 24.8 | 22.975 | 1.837 |
| 4 | 26.3 | 21.669 | 4.620 |
| 5 | 26.0 | 20.364 | 5.603 |
| 6 | 23.5 | 19.059 | 4.484 |
| 7 | 24.2 | 17.753 | 6.482 |
| 8 | 21.3 | 16.448 | 4.868 |
| 9 | 18.3 | 15.142 | 3.191 |
| 10 | 17.3 | 13.837 | 3.459 |
| 11 | 11.4 | 12.531 | -1.088 |
| 12 | 4.3 | 11.226 | -6.925 |
| 13 | 0.4 | 9.920 | -9.499 |
Sometimes different kinds of model can be fitted to the same data reasonably well. In such cases, any of the models may be used for interpolation. But different types of model give substantially different predictions when extrapolated, so it is important to have ways of choosing among them if prediction of future values is intended, as it often is. This is more of an issue when you are aware of the many different possibilities for model formulas, as you will be by the end of this course. Here are some of the ways that people use to decide among models.
- Examine how well the different models fit the graph: This is the basic test of a model, and you can eliminate any kind of model whose best-fit graph is clearly inferior to that of another possibility. If none of the kinds of models you know about can be made to fit the data well, you should avoid making predictions with those models for the process that produced that data.
- Examine how positive and negative residual deviations are mixed: For the best model, the sequence of deviations will be a random mix of positive and negative values, indicating that the data points are randomly scattered above and below the model points. Big adjacent groups of positive or negative residual values that cannot be avoided by changing the parameters indicate that the model does not match the data pattern.
- Prior information: Make use of information you have about the process being modeled other than the data values themselves. This may be your own knowledge about the kind of process that produced the data, or experts in the field may have already identified what kinds of models are best for the kind of data you have.
- Extrapolation behavior of the model: If extending the model a moderate distance forward or back from the data values gives unreasonable predictions (such as negative values for population), that model should be avoided, especially if one of the other possibilities has better extrapolation behavior.
- Numerical measures: In a later topic you will learn how to use and interpret the standard deviation, a numerical measure of how good the fit is between a dataset and a particular model. This value is based on the differences (in column D) between the data (in column B) and the model prediction (in column C). The best model will usually have the smallest standard deviation.
