
21 Z-Scores
Objectives
- Here you will learn how z-scores can be used to evaluate how extreme a given value is in a particular set or
population. - Here you will learn to evaluate z-scores as they relate to probability.
- Here you will learn to calculate the probability of a z-score between two others.
Part I
Using the Empirical Rule can give you a good idea of the probability of occurrence of a value that happens to be exactly one, two or three to either side of the mean, but how do you compare the probabilities of values that are in between standard deviations?
Watch This: Maths Tutorial: Z scores
The British video below is very clear and easy to follow. It is worth noting, particularly for US students, that the instructor uses the notation x rather than µ for mean, and pronounces z as “zed.”
Z-scores are related to the Empirical Rule from the standpoint of being a method of evaluating how extreme a particular value is in a given set. You can think of a z-score as the number of standard deviations there are between a given value and the mean of the set. While the Empirical Rule allows you to associate the first three standard deviations with the percentage of data that each SD includes, the z-score allows you to state (as accurately as you like), just how many SDs a given value is above or below the mean.
Conceptually, the z-score calculation is just what you might expect, given that you are calculating the number of SDs between a value and the mean. You calculate the z-score by first calculating the difference between your value and the mean, and then dividing that amount by the standard deviation of the set. The formula looks like this:
[latex]\displaystyle\text{z-score}=\frac{(\text{value}-\text{mean})}{\text{standard deviation}}=\frac{(x=\mu)}{\sigma}\\[/latex]
In this lesson, we will practice calculating the z-score for various values. In the next lesson, we will learn how to associate the z-score of a value with the probability that the value will occur.
Example 1
What is the z-score of a value of 27, given a set mean of 24, and a standard deviation of 2?
Solution
To find the z-score we need to divide the difference between the value, 27, and the mean, 24, by the standard deviation of the set, 2.
[latex]\displaystyle\text{z-score}=\frac{27-\mu}{\sigma}=\frac{27-24}{2}=\frac{3}{2}\\[/latex]
[latex]\displaystyle\text{z-score of }27=+1.5\\[/latex]
This indicates that 27 is 1.5 standard deviations above the mean.
Example 2
What is the z-score of a value of 104.5, in a set with µ = 125 and σ = 6.2?
Solution
Find the difference between the given value and the mean, then divide it by the standard deviation.
[latex]\displaystyle\text{z-score}=\frac{104.5-\mu}{\sigma}=\frac{104.5-125}{6.2}=\frac{-20.5}{6.2}\\[/latex]
[latex]\displaystyle\text{z-score of }104005=-3.306\\[/latex]
Note that the z-score is negative, since the measured value, 104.5, is less than (below) the mean, 125.
Example 3
Find the value represented by a z-score of 2.403, given µ = 63 and σ = 4.25.
Solution
This one requires that we solve for a missing value rather than for a missing z-score, so we just need to fill in our formula with what we know and solve for the missing value:
[latex]\displaystyle\text{z-score}=\frac{x-\mu}{\sigma}\\[/latex]
[latex]\displaystyle2.403=\frac{x-63}{4.25}\\[/latex]
[latex]\displaystyle10.213=x-63\\[/latex]
[latex]73.213=x\\[/latex]
73.213 has a z-score of 2.403
Intro Problem Revisited
Using the Empirical Rule can give you a good idea of the probability of occurrence of a value that happens to be right on one of the first three standard deviations to either side of the mean, but how do you compare the probabilities of values that are in between standard deviations?
The z-score of a value is the count of the number of standard deviations between the value and the mean of the set. You can find it by subtracting the value from the mean, and dividing the result by the standard deviation.
Vocabulary
The z-score of a value is the number of standard deviations between the value and the mean of the set.
Guided Practice

- What is the z-score of the price of a pair of skis that cost $247, if the mean ski price is $279, with a standard deviation of $16?
- What is the z-score of a 5-scoop ice cream cone if the mean number of scoops is 3, with a standard deviation of 1 scoop?
- What is the z-score of the weight of a cow that tips the scales at 825 lbs, if the mean weight for cows of her type is 1150 lbs, with a standard deviation of 77 lbs?
- What is the z-score of a measured value of 0.0034, given µ = 0.0041 and σ = 0.0008?
Solutions
- First find the difference between the measured value and the mean, then divide that difference by the standard deviation:
[latex]\frac{247-279}{16}=\frac{-32}{16}\\[/latex]
z-score = −2 - This one is easy: The difference between 5 scoops and 3 scoops is +2, and we divide that by the standard deviation of 1, so the z-score is +2.
- First find the difference between the measured value and the mean, then divide that difference by the standard deviation:
[latex]\frac{825\text{ lbs}-1150\text{ lbs}}{771\text{ lbs}}=\frac{-325}{77}\\[/latex]
z-score = −4.2407 - First find the difference between the measured value and the mean, then divide that difference by the standard deviation:
[latex]\frac{0.0034-0.0041}{0.0008}=\frac{-0.0007}{0.0008}\\[/latex]
z-score = −0.875
Part II
Knowing the z-score of a given value is great, but what can you do with it? How does a z-score relate to probability? What is the probability of occurrence of a z-score less than +2.47?
Watch This: The Normal Distribution
The video below provides a demonstration of how to use a z-score probability reference table, as we do in this lesson. The table he uses in the video is slightly different, but the concept is the same.
Since z-scores are a measure of the number of SDs between a value and the mean, they can be used to calculate probability by comparing the location of the z-score to the area under a normal curve either to the left or right. The area can be calculated using calculus, but we will just use a table to look up the area.
I believe that the concept of comparing z-scores to probability is most easily understood with a graphic like the one we used in the lesson on the Empirical Rule, so I included one below. Be sure to review the examples to see how the scores work.
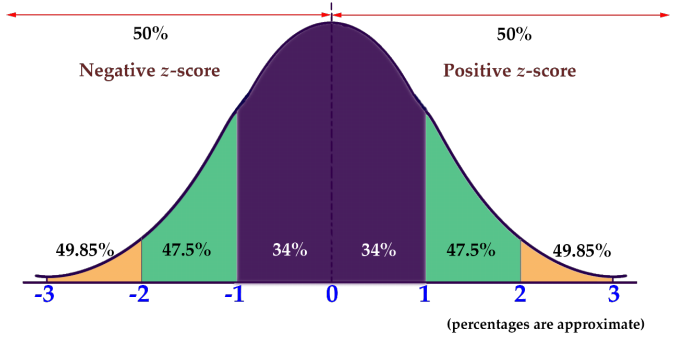
Like the graphic we viewed in the Empirical Rule lesson, this one only provides probability percentages for integer values of z-scores (standard deviations). In order to find the values for z-scores that aren’t integers, you can use a table like the one below. To find the value associated with a given z-score, you find the first decimal of your z-score on the left or right side and then the 2nd decimal of your z-score across the top or bottom of the table. Where they intersect you will find the decimal expression of the percentage of values that are less than your sample (see example 4).
| Table 1 (scroll to see all values) | |||||||||||
|---|---|---|---|---|---|---|---|---|---|---|---|
| Z | 0.00 | 0.01 | 0.02 | 0.03 | 0.04 | 0.05 | 0.06 | 0.07 | 0.08 | 0.09 | Z |
| 0.0 | 0.5 | 0.504 | 0.508 | 0.512 | 0.516 | 0.5199 | 0.5239 | 0.5279 | 0.5319 | 0.5359 | 0.0 |
| 0.1 | 0.5398 | 0.5438 | 0.5478 | 0.5517 | 0.5557 | 0.5596 | 0.5636 | 0.5675 | 0.5714 | 0.5753 | 0.1 |
| 0.2 | 0.5793 | 0.5832 | 0.5871 | 0.591 | 0.5948 | 0.5987 | 0.6026 | 0.6064 | 0.6103 | 0.6141 | 0.2 |
| 0.3 | 0.6179 | 0.6217 | 0.6255 | 0.6293 | 0.6331 | 0.6368 | 0.6406 | 0.6443 | 0.648 | 0.6517 | 0.3 |
| 0.4 | 0.6554 | 0.6591 | 0.6628 | 0.6664 | 0.67 | 0.6736 | 0.6772 | 0.6808 | 0.6844 | 0.6879 | 0.4 |
| 0.5 | 0.6915 | 0.695 | 0.6985 | 0.7019 | 0.7054 | 0.7088 | 0.7123 | 0.7157 | 0.719 | 0.7224 | 0.5 |
| 0.6 | 0.7257 | 0.7291 | 0.7324 | 0.7357 | 0.7389 | 0.7422 | 0.7454 | 0.7486 | 0.7517 | 0.7549 | 0.6 |
| 0.7 | 0.758 | 0.7611 | 0.7642 | 0.7673 | 0.7704 | 0.7734 | 0.7764 | 0.7794 | 0.7823 | 0.7852 | 0.7 |
| 0.8 | 0.7881 | 0.791 | 0.7939 | 0.7967 | 0.7995 | 0.8023 | 0.8051 | 0.8078 | 0.8106 | 0.8133 | 0.8 |
| 0.9 | 0.8159 | 0.8186 | 0.8212 | 0.8238 | 0.8264 | 0.8289 | 0.8315 | 0.834 | 0.8365 | 0.8389 | 0.9 |
| 1.0 | 0.8413 | 0.8438 | 0.8461 | 0.8485 | 0.8508 | 0.8531 | 0.8554 | 0.8577 | 0.8599 | 0.8621 | 1.0 |
| 1.1 | 0.8643 | 0.8665 | 0.8686 | 0.8708 | 0.8729 | 0.8749 | 0.877 | 0.879 | 0.881 | 0.883 | 1.1 |
| 1.2 | 0.8849 | 0.8869 | 0.8888 | 0.8907 | 0.8925 | 0.8944 | 0.8962 | 0.898 | 0.8997 | 0.9015 | 1.2 |
| 1.3 | 0.9032 | 0.9049 | 0.9066 | 0.9082 | 0.9099 | 0.9115 | 0.9131 | 0.9147 | 0.9162 | 0.9177 | 1.3 |
| 1.4 | 0.9192 | 0.9207 | 0.9222 | 0.9236 | 0.9251 | 0.9265 | 0.9279 | 0.9292 | 0.9306 | 0.9319 | 1.4 |
| 1.5 | 0.9332 | 0.9345 | 0.9357 | 0.937 | 0.9382 | 0.9394 | 0.9406 | 0.9418 | 0.9429 | 0.9441 | 1.5 |
| 1.6 | 0.9452 | 0.9463 | 0.9474 | 0.9484 | 0.9495 | 0.9505 | 0.9515 | 0.9525 | 0.9535 | 0.9545 | 1.6 |
| 1.7 | 0.9554 | 0.9564 | 0.9573 | 0.9582 | 0.9591 | 0.9599 | 0.9608 | 0.9616 | 0.9625 | 0.9633 | 1.7 |
| 1.8 | 0.9641 | 0.9649 | 0.9656 | 0.9664 | 0.9671 | 0.9678 | 0.9686 | 0.9693 | 0.9699 | 0.9706 | 1.8 |
| 1.9 | 0.9713 | 0.9719 | 0.9726 | 0.9732 | 0.9738 | 0.9744 | 0.975 | 0.9756 | 0.9761 | 0.9767 | 1.9 |
| 2.0 | 0.9772 | 0.9778 | 0.9783 | 0.9788 | 0.9793 | 0.9798 | 0.9803 | 0.9808 | 0.9812 | 0.9817 | 2.0 |
| 2.1 | 0.9821 | 0.9826 | 0.983 | 0.9834 | 0.9838 | 0.9842 | 0.9846 | 0.985 | 0.9854 | 0.9857 | 2.1 |
| 2.2 | 0.9861 | 0.9864 | 0.9868 | 0.9871 | 0.9875 | 0.9878 | 0.9881 | 0.9884 | 0.9887 | 0.989 | 2.2 |
| 2.3 | 0.9893 | 0.9896 | 0.9898 | 0.9901 | 0.9904 | 0.9906 | 0.9909 | 0.9911 | 0.9913 | 0.9916 | 2.3 |
| 2.4 | 0.9918 | 0.992 | 0.9922 | 0.9925 | 0.9927 | 0.9929 | 0.9931 | 0.9932 | 0.9934 | 0.9936 | 2.4 |
| 2.5 | 0.9938 | 0.994 | 0.9941 | 0.9943 | 0.9945 | 0.9946 | 0.9948 | 0.9949 | 0.9951 | 0.9952 | 2.5 |
| 2.6 | 0.9953 | 0.9955 | 0.9956 | 0.9957 | 0.9959 | 0.996 | 0.9961 | 0.9962 | 0.9963 | 0.9964 | 2.6 |
| 2.7 | 0.9965 | 0.9966 | 0.9967 | 0.9968 | 0.9969 | 0.997 | 0.9971 | 0.9972 | 0.9973 | 0.9974 | 2.7 |
| 2.8 | 0.9974 | 0.9975 | 0.9976 | 0.9977 | 0.9977 | 0.9978 | 0.9979 | 0.9979 | 0.998 | 0.9981 | 2.8 |
| 2.9 | 0.9981 | 0.9982 | 0.9982 | 0.9983 | 0.9984 | 0.9984 | 0.9985 | 0.9985 | 0.9986 | 0.9986 | 2.9 |
| 3.0 | 0.9987 | 0.9987 | 0.9987 | 0.9988 | 0.9988 | 0.9989 | 0.9989 | 0.9989 | 0.999 | 0.999 | 3.0 |
| 3.1 | 0.999 | 0.9991 | 0.9991 | 0.9991 | 0.9992 | 0.9992 | 0.9992 | 0.9992 | 0.9993 | 0.9993 | 3.1 |
| 3.2 | 0.9993 | 0.9993 | 0.9994 | 0.9994 | 0.9994 | 0.9994 | 0.9994 | 0.9995 | 0.9995 | 0.9995 | 3.2 |
| 3.3 | 0.9995 | 0.9995 | 0.9995 | 0.9996 | 0.9996 | 0.9996 | 0.9996 | 0.9996 | 0.9996 | 0.9997 | 3.3 |
| 3.4 | 0.9997 | 0.9997 | 0.9997 | 0.9997 | 0.9997 | 0.9997 | 0.9997 | 0.9997 | 0.9997 | 0.9998 | 3.4 |
| 3.5 | 0.9998 | 0.9998 | 0.9998 | 0.9998 | 0.9998 | 0.9998 | 0.9998 | 0.9998 | 0.9998 | 0.9998 | 3.5 |
| 3.6 | 0.9998 | 0.9998 | 0.9999 | 0.9999 | 0.9999 | 0.9999 | 0.9999 | 0.9999 | 0.9999 | 0.9999 | 3.6 |
| 3.7 | 0.9999 | 0.9999 | 0.9999 | 0.9999 | 0.9999 | 0.9999 | 0.9999 | 0.9999 | 0.9999 | 0.9999 | 3.7 |
| 3.8 | 0.9999 | 0.9999 | 0.9999 | 0.9999 | 0.9999 | 0.9999 | 0.9999 | 0.9999 | 0.9999 | 0.9999 | 3.8 |
| 3.9 | 1 | 1 | 1 | 1 | 1 | 1 | 1 | 1 | 1 | 1 | 3.9 |
| Z | 0.00 | 0.01 | 0.02 | 0.03 | 0.04 | 0.05 | 0.06 | 0.07 | 0.08 | 0.09 | Z |
Z-score tables like the one above describe the probability that a given value, or any value less than it, will occur in a given set. This particular table assumes you are looking to find the probability associated with a positive z-score. You may have additional work to do if the z-score is negative.
- To find the percentage of values greater than a negative Z score, just look up the matching positive Z score value.
- To find the percentage of values less than a negative z-score, subtract the chart value from 1.
- To find the percentage of values greater than a positive z-score, subtract the chart value from 1.
Example 4
What is the probability that a value with a z-score less than 2.47 will occur in a normal distribution?
Solution
Scroll up to the table above and find “2.4” on the left or right side. Now move across the table to “0.07” on the top or bottom, and record the value in the cell: 0.9932. That tells us that 99.32% of values in the set are at or below a z-score of 2.47.
Example 5
What is the probability that a value with a z-score greater than 1.53 will occur in a normal distribution?
Solution
Scroll up to the table of z-score probabilities again and find the intersection between 1.5 on the left or right and 3 on the top or bottom, record the value in the cell: 0.937.
That decimal lets us know that 93.7% of values in the set are below the z-score of 1.53. To find the percentage that is above that value, we subtract 0.937 from 1.0 (or 93.7% from 100%), to get 0.063 or 6.3%.
Example 6
What is the probability of a random selection being less than 3.65, given a normal distribution with µ = 5 and σ = 2.2?
Solution
This question requires us to first find the z-score for the value 3.65, then calculate the percentage of values below
that z-score from a reference.
- Find the z-score for 3.65, using the z-score formula: [latex]\frac{(x-\mu)}{\sigma}=\frac{3.65-5}{2.2}=\frac{-1.35}{2.2}\approx{-0.61}\\[/latex]
- Now we can scroll up to our z-score reference above and find the intersection of 0.6 and 0.01, which should be .7291.
- Since this is a negative z-score, and we want the percentage of values below it, we subtract that decimal from 1.0 (reference the three steps highlighted by bullet points below the chart if you didn’t recall this), to get 1 − .7291 = .2709
There is approximately a 27.09% probability that a value less than 3.65 would occur from a random selection
of a normal distribution with mean 5 and standard deviation 2. 2.
Concept Problem Revisited
Knowing the z-score of a given value is great, but what can you do with it? How does a z-score relate to probability? What is the probability of occurrence of a z-score less than 2.47?
A z-score lets you calculate the probability that a randomly selected value will be greater or less than a particular value in a set.
To find the probability of a z-score below +2.47, using a reference such as the table in the lesson above:
- Find 2.4 on the left or right side
- Move across to 0.07 on the top or bottom.
- The cell you arrive at says: 0.9932, which means that apx 99.32% of the values in a normal distribution will occur below a z-score of 2.47.
Vocabulary
Z-score table: a table that associates the various common z-scores between 0 and 3.99 with the decimal probability of being less than or equal to that z-score.
Guided Practice
- What is the probability of occurrence of a value with z-score greater than 1.24?
- What is the probability of z < −.23?
- What is P(Z < 2.13)?
Solutions
- Since this is a positive z-score, we can use the value for z = 1.24 directly from the table, and just express it as a percentage: 0.8925 or 89.25%
- This is a negative z-score, and we want the percentage of values greater than it, so we need to subtract the value for z = +0.23 from 1: 1 − 0.591 = .409 or 40.9%
- This is a positive z-score, and we need the percentage of values below it, so we can use the percentage associated with z = +2.13 directly from the table: 0.9834 or 98.34%
Part III
Do z-score probabilities always need to be calculated as the chance of a value either above or below a given score? How would you calculate the probability of a z-score between −0.08 and +1.92?
Watch This: Reading Probabilities from the Z-table
To calculate the probability of getting a value with a z-score between two other z-scores, you can either use a reference table to look up the value for both scores and subtract them to find the difference, or you can use technology. In this lesson, which is an extension of Z-scores and Z-scores II, we will practice both methods.
Historically, it has been very common to use a z-score probability table like the one below to look up the probability associated with a given z-score:
| Table 2 (scroll to see all values) | |||||||||||
|---|---|---|---|---|---|---|---|---|---|---|---|
| Z | 0.00 | 0.01 | 0.02 | 0.03 | 0.04 | 0.05 | 0.06 | 0.07 | 0.08 | 0.09 | Z |
| 0.0 | 0.5 | 0.504 | 0.508 | 0.512 | 0.516 | 0.5199 | 0.5239 | 0.5279 | 0.5319 | 0.5359 | 0.0 |
| 0.1 | 0.5398 | 0.5438 | 0.5478 | 0.5517 | 0.5557 | 0.5596 | 0.5636 | 0.5675 | 0.5714 | 0.5753 | 0.1 |
| 0.2 | 0.5793 | 0.5832 | 0.5871 | 0.591 | 0.5948 | 0.5987 | 0.6026 | 0.6064 | 0.6103 | 0.6141 | 0.2 |
| 0.3 | 0.6179 | 0.6217 | 0.6255 | 0.6293 | 0.6331 | 0.6368 | 0.6406 | 0.6443 | 0.648 | 0.6517 | 0.3 |
| 0.4 | 0.6554 | 0.6591 | 0.6628 | 0.6664 | 0.67 | 0.6736 | 0.6772 | 0.6808 | 0.6844 | 0.6879 | 0.4 |
| 0.5 | 0.6915 | 0.695 | 0.6985 | 0.7019 | 0.7054 | 0.7088 | 0.7123 | 0.7157 | 0.719 | 0.7224 | 0.5 |
| 0.6 | 0.7257 | 0.7291 | 0.7324 | 0.7357 | 0.7389 | 0.7422 | 0.7454 | 0.7486 | 0.7517 | 0.7549 | 0.6 |
| 0.7 | 0.758 | 0.7611 | 0.7642 | 0.7673 | 0.7704 | 0.7734 | 0.7764 | 0.7794 | 0.7823 | 0.7852 | 0.7 |
| 0.8 | 0.7881 | 0.791 | 0.7939 | 0.7967 | 0.7995 | 0.8023 | 0.8051 | 0.8078 | 0.8106 | 0.8133 | 0.8 |
| 0.9 | 0.8159 | 0.8186 | 0.8212 | 0.8238 | 0.8264 | 0.8289 | 0.8315 | 0.834 | 0.8365 | 0.8389 | 0.9 |
| 1.0 | 0.8413 | 0.8438 | 0.8461 | 0.8485 | 0.8508 | 0.8531 | 0.8554 | 0.8577 | 0.8599 | 0.8621 | 1.0 |
| 1.1 | 0.8643 | 0.8665 | 0.8686 | 0.8708 | 0.8729 | 0.8749 | 0.877 | 0.879 | 0.881 | 0.883 | 1.1 |
| 1.2 | 0.8849 | 0.8869 | 0.8888 | 0.8907 | 0.8925 | 0.8944 | 0.8962 | 0.898 | 0.8997 | 0.9015 | 1.2 |
| 1.3 | 0.9032 | 0.9049 | 0.9066 | 0.9082 | 0.9099 | 0.9115 | 0.9131 | 0.9147 | 0.9162 | 0.9177 | 1.3 |
| 1.4 | 0.9192 | 0.9207 | 0.9222 | 0.9236 | 0.9251 | 0.9265 | 0.9279 | 0.9292 | 0.9306 | 0.9319 | 1.4 |
| 1.5 | 0.9332 | 0.9345 | 0.9357 | 0.937 | 0.9382 | 0.9394 | 0.9406 | 0.9418 | 0.9429 | 0.9441 | 1.5 |
| 1.6 | 0.9452 | 0.9463 | 0.9474 | 0.9484 | 0.9495 | 0.9505 | 0.9515 | 0.9525 | 0.9535 | 0.9545 | 1.6 |
| 1.7 | 0.9554 | 0.9564 | 0.9573 | 0.9582 | 0.9591 | 0.9599 | 0.9608 | 0.9616 | 0.9625 | 0.9633 | 1.7 |
| 1.8 | 0.9641 | 0.9649 | 0.9656 | 0.9664 | 0.9671 | 0.9678 | 0.9686 | 0.9693 | 0.9699 | 0.9706 | 1.8 |
| 1.9 | 0.9713 | 0.9719 | 0.9726 | 0.9732 | 0.9738 | 0.9744 | 0.975 | 0.9756 | 0.9761 | 0.9767 | 1.9 |
| 2.0 | 0.9772 | 0.9778 | 0.9783 | 0.9788 | 0.9793 | 0.9798 | 0.9803 | 0.9808 | 0.9812 | 0.9817 | 2.0 |
| 2.1 | 0.9821 | 0.9826 | 0.983 | 0.9834 | 0.9838 | 0.9842 | 0.9846 | 0.985 | 0.9854 | 0.9857 | 2.1 |
| 2.2 | 0.9861 | 0.9864 | 0.9868 | 0.9871 | 0.9875 | 0.9878 | 0.9881 | 0.9884 | 0.9887 | 0.989 | 2.2 |
| 2.3 | 0.9893 | 0.9896 | 0.9898 | 0.9901 | 0.9904 | 0.9906 | 0.9909 | 0.9911 | 0.9913 | 0.9916 | 2.3 |
| 2.4 | 0.9918 | 0.992 | 0.9922 | 0.9925 | 0.9927 | 0.9929 | 0.9931 | 0.9932 | 0.9934 | 0.9936 | 2.4 |
| 2.5 | 0.9938 | 0.994 | 0.9941 | 0.9943 | 0.9945 | 0.9946 | 0.9948 | 0.9949 | 0.9951 | 0.9952 | 2.5 |
| 2.6 | 0.9953 | 0.9955 | 0.9956 | 0.9957 | 0.9959 | 0.996 | 0.9961 | 0.9962 | 0.9963 | 0.9964 | 2.6 |
| 2.7 | 0.9965 | 0.9966 | 0.9967 | 0.9968 | 0.9969 | 0.997 | 0.9971 | 0.9972 | 0.9973 | 0.9974 | 2.7 |
| 2.8 | 0.9974 | 0.9975 | 0.9976 | 0.9977 | 0.9977 | 0.9978 | 0.9979 | 0.9979 | 0.998 | 0.9981 | 2.8 |
| 2.9 | 0.9981 | 0.9982 | 0.9982 | 0.9983 | 0.9984 | 0.9984 | 0.9985 | 0.9985 | 0.9986 | 0.9986 | 2.9 |
| 3.0 | 0.9987 | 0.9987 | 0.9987 | 0.9988 | 0.9988 | 0.9989 | 0.9989 | 0.9989 | 0.999 | 0.999 | 3.0 |
| 3.1 | 0.999 | 0.9991 | 0.9991 | 0.9991 | 0.9992 | 0.9992 | 0.9992 | 0.9992 | 0.9993 | 0.9993 | 3.1 |
| 3.2 | 0.9993 | 0.9993 | 0.9994 | 0.9994 | 0.9994 | 0.9994 | 0.9994 | 0.9995 | 0.9995 | 0.9995 | 3.2 |
| 3.3 | 0.9995 | 0.9995 | 0.9995 | 0.9996 | 0.9996 | 0.9996 | 0.9996 | 0.9996 | 0.9996 | 0.9997 | 3.3 |
| 3.4 | 0.9997 | 0.9997 | 0.9997 | 0.9997 | 0.9997 | 0.9997 | 0.9997 | 0.9997 | 0.9997 | 0.9998 | 3.4 |
| 3.5 | 0.9998 | 0.9998 | 0.9998 | 0.9998 | 0.9998 | 0.9998 | 0.9998 | 0.9998 | 0.9998 | 0.9998 | 3.5 |
| 3.6 | 0.9998 | 0.9998 | 0.9999 | 0.9999 | 0.9999 | 0.9999 | 0.9999 | 0.9999 | 0.9999 | 0.9999 | 3.6 |
| 3.7 | 0.9999 | 0.9999 | 0.9999 | 0.9999 | 0.9999 | 0.9999 | 0.9999 | 0.9999 | 0.9999 | 0.9999 | 3.7 |
| 3.8 | 0.9999 | 0.9999 | 0.9999 | 0.9999 | 0.9999 | 0.9999 | 0.9999 | 0.9999 | 0.9999 | 0.9999 | 3.8 |
| 3.9 | 1 | 1 | 1 | 1 | 1 | 1 | 1 | 1 | 1 | 1 | 3.9 |
| Z | 0.00 | 0.01 | 0.02 | 0.03 | 0.04 | 0.05 | 0.06 | 0.07 | 0.08 | 0.09 | Z |
Since the proliferation of the Internet, however, you can also use a free online calculator such as one of these three:
Example 7
What is the probability associated with a z-score between 1.2 and 2.31?
Solution
To evaluate the probability of a value occurring within a given range, you need to find the probability of both the upper and lower values in the range, and subtract to find the difference.
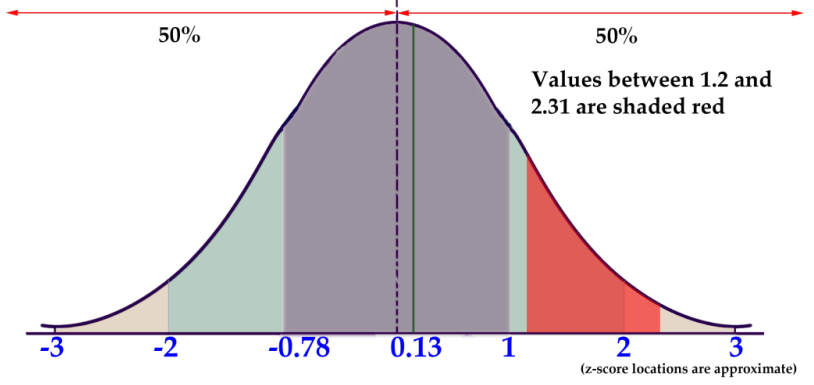
- First find z = 1.2 on the z-score probability reference above: .8849. Remember that value represents the percentage of values below 1.2.
- Next, find and record the value associated with z = 2.31: .9896
- Since approximately 88.49% of all values are below z = 1.2 and approximately 98.96% of all values are below z = 2.31, there are 98.96% −88.49% = 10.47% of values between.
Example 8
What is the probability that a value with a z-score between -1.32 and +1.49 will occur in a normal distribution?
Solution
Let’s use the online calculator at mathportal.org for this one. When you open the page, you should see a window like this:
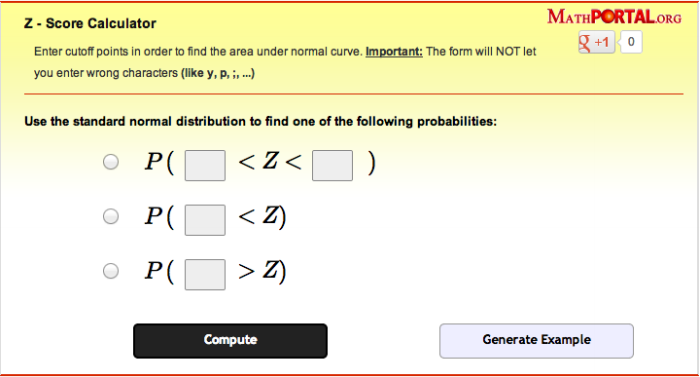
All you need to do is select the radio button to the left of the first type of probability, input “−1.32” into the first box, and 1.49 into the second. When you click Compute, you should get the result P(−1.32 < Z < 1.49) = 0.8385
Which tells us that there is approximately and 83.85% probability that a value with a z-score between 1.32 and 1.49 will occur in a normal distribution.
Notice that the calculator also details the steps involved with finding the answer:
- Estimate the probability using a graph, so you have an idea of what your answer should be.
- Find the probability of z < 1.49, using a reference. (0.9319)
- Find the probability of z < −1.32, again, using a reference. (0.0934)
- Subtract the values: 0.9319 − 0.0934 = 0.8385 or 83.85%
Example 9
What is the probability that a random selection will be between 8.45 and 10.25, if it is from a normal distribution with µ = 10 and σ = 2?
Solution
This question requires us to first find the z-scores for the value 8.45 and 10.25, then calculate the percentage of value between them by using values from a z-score reference and finding the difference.
- Find the z-score for 8.45, using the z-score formula: [latex]\frac{(x-\mu)}{\sigma}\\[/latex]
[latex]\frac{8.45-10}{2}=\frac{-1.55}{2}\approx{-0.78}\\[/latex] - Find the z-score for 10.25 the same way:
[latex]\frac{10.25-10}{2}=\frac{0.25}{2}\approx{.13}\\[/latex] - Now find the percentages for each, using a reference (don’t forget we want the probability of values less than our negative score and less than our positive score, so we can find the values between):
P(Z < −0.78) = .2177 or 21.77%
P(Z < .13) = .5517 or 55.17% - At this point, let’s sketch the graph to get an idea what we are looking for:
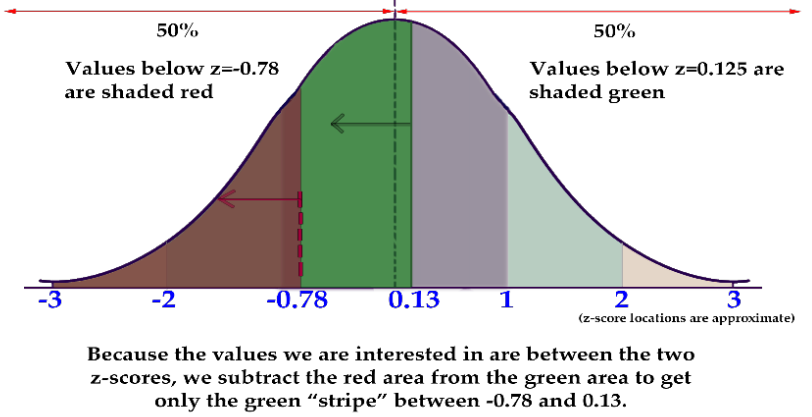
- Finally, subtract the values to find the difference:
.5517 − .2177 = .3340 or about 33.4%
There is approximately a 33.4% probability that a value between 8.45 and 10.25 would result from a random selection of a normal distribution with mean 10 and standard deviation 2.
Concept Problem Revisited
Do z-score probabilities always need to be calculated as the chance of a value either above or below a given score? How would you calculate the probability of a z-score between −0.08 and +1.92?
After this lesson, you should know without question that z-score probabilities do not need to assume only probabilities above or below a given value, the probability between values can also be calculated.
The probability of a z-score below −0.08 is 46.81%, and the probability of a z-score below 1.92 is 97.26%, so the probability between them is 97.26%−46.81% = 50.45%.
Vocabulary
z-score: a measure of how many standard deviations there are between a data value and the mean.
z-score probability table: a table that associates z-scores to area under the normal curve. The table may be used to associate a Z-score with a percent probability.
Guided Practice
- What is the probability of a z-score between −0.93 and 2.11?
- What is P(1.39 < Z < 2.03)?
- What is P(−2.11 < Z < 2.11)?
Solutions
- Using the z-score probability table above, we can see that the probability of a value below −0.93 is .1762, and the probability of a value below 2.11 is .9826. Therefore, the probability of a value between them is .9826−.1762 = .8064 or 80.64%
- Using the z-score probability table, we see that the probability of a value below z = 1.39 is .9177, and a value below z = 2.03 is .9788. That means that the probability of a value between them is .9788 − .9177 = .0611 or 6.11%
- Using the online calculator at mathportal.org, we select the top calculation with the associated radio button to the left of it, enter “−2.11” in the first box, and “2.11” in the second box. Click Compute to get “ .9652,” and convert to a percentage. The probability of a z-score between −2.11 and +2.11 is about 96.52%.
Practice Questions
- Given a distribution with a mean of 70 and standard deviation of 62, find a value with a z-score of −1.82.
- What does a z-score of 3.4 mean?
- Given a distribution with a mean of 60 and standard deviation of 98, find the z-score of 120.76.
- Given a distribution with a mean of 60 and standard deviation of 21, find a value with a z-score of 2.19.
- Find the z-score of 187.37, given a distribution with a mean of 185 and standard deviation of 1.
- What does a z-score of −3.8 mean?
- Find the z-score of 125.18, given a distribution with a mean of 101 and standard deviation of 62.
- Given a distribution with a mean of 117 and standard deviation of 42, find a value with a z-score of −0.94.
- Given a distribution with a mean of 126 and standard deviation of 100, find a value with a z-score of −0.75.
- Find the z-score of 264.16, given µ = 188 and σ = 64.
- Find a value with a z-score of −0.2, given µ = 145 and σ = 56.
- Find the z-score of 89.79 given µ = 10 and σ = 79.
Find the probabilities, use the table from the lesson above.
- What is the probability of a z-score less than +2.02?
- What is the probability of a z-score greater than +2.02?
- What is the probability of a z-score less than −1.97?
- What is the probability of a z-score greater than −1.97?
- What is the probability of a z-score less than +0.09?
- What is the probability of a z-score less than −0.02?
- What is P(Z < 1.71)?
- What is P(Z > 2.22)?
- What is P(Z < −1.19)?
- What is P(Z > −2.71)?
- What is P(Z < 3.71)?
- What is the probability of the random occurrence of a value greater than 56 from a normally distributed population with mean 62 and standard deviation 4.5?
- What is the probability of a value of 329 or greater, assuming a normally distributed set with mean 290 and standard deviation 32?
- What is the probability of getting a value below 1.2 from the random output of a normally distributed set with µ = 2.6 and σ = .9?
Find the probabilities, use the table from the lesson or an online resource.
- What is the probability of a z-score between +1.99 and +2.02?
- What is the probability of a z-score between −1.99 and +2.02?
- What is the probability of a z-score between −1.20 and −1.97?
- What is the probability of a z-score between +2.33 and −0.97?
- What is the probability of a z-score greater than +0.09?
- What is the probability of a z-score greater than −0.02?
- What is P(1.42 < Z < 2.01)?
- What is P(1.77 < Z < 2.22)?
- What is P(−2.33 < Z < −1.19)?
- What is P(−3.01 < Z < −0.71)?
- What is P(2.66 < Z < 3.71)?
- What is the probability of the random occurrence of a value between 56 and 61 from a normally distributed population with mean 62 and standard deviation 4.5?
- What is the probability of a value between 301 and 329, assuming a normally distributed set with mean 290 and standard deviation 32?
- What is the probability of getting
