
250 Reading: Measuring Return
Return
You want to choose investments that will combine to achieve the return objectives and level of risk that’s right for you, but how do you know what the right combination will be? You can’t predict the future, but you can make an educated guess based on an investment’s past history. To do this, you need to know how to read or use the information available. Perhaps the most critical information to have about an investment is its potential return and susceptibility to types of risk.
Returns are typically calculated as annual rates of return, or the percentage of return created for each unit (dollar) of original value. If an investment earns 5 percent, for example, that means that for every $100 invested, you would earn $5 per year (because $5 = 5% of $100).
Returns are created in two ways: the investment creates income or the investment gains (or loses) value. To calculate the annual rate of return for an investment, you need to know the income created, the gain (loss) in value, and the original value at the beginning of the year. The percentage return can be calculated as follows:
(Income + Gain) / Original value = Percentage rate of return
(Income + (Ending value – Original value)) / Original value = Percentage rate of return
Note that if the ending value is greater than the original value, then Ending value − Original value > 0 (is greater than zero), and you have a gain that adds to your return. If the ending value is less, then Ending value − Original value < 0 (is less than zero), and you have a loss that detracts from your return. If there is no gain or loss, if Ending value − Original value = 0 (is the same), then your return is simply the income that the investment created.
For example, if you buy a share of stock for $100, and it pays no dividend, and a year later the market price is $105, then your return = [0 + (105 − 100)] ÷ 100 = 5 ÷ 100 = 5%. If the same stock paid a dividend of $2, then your return = [2 + (105 − 100)] ÷ 100 = 7 ÷ 100 = 7%.
While information about current and past returns is useful, investment professionals are more concerned with the expected return for the investment, that is, how much it may be expected to earn in the future. Estimating the expected return is complicated because many factors (i.e., current economic conditions, industry conditions, and market conditions) may affect that estimate.
For investments with a long history, a strong indicator of future performance may be past performance. Economic cycles fluctuate, and industry and firm conditions vary, but over the long run, an investment that has survived has weathered all those storms. So you could look at the average of the returns for each year. There are several ways to do the math, but if you look at the average return for different investments of the same asset class or type (e.g., stocks of large companies) you could compare what they have returned, on average, over time. Figure 2 shows average returns on investments in the S&P 500, an index of large U.S. companies since 1990.
Figure 2. S&P 500 Average Annual Return Based on data from Standard & Poor’s, Inc., (accessed November 24, 2009).
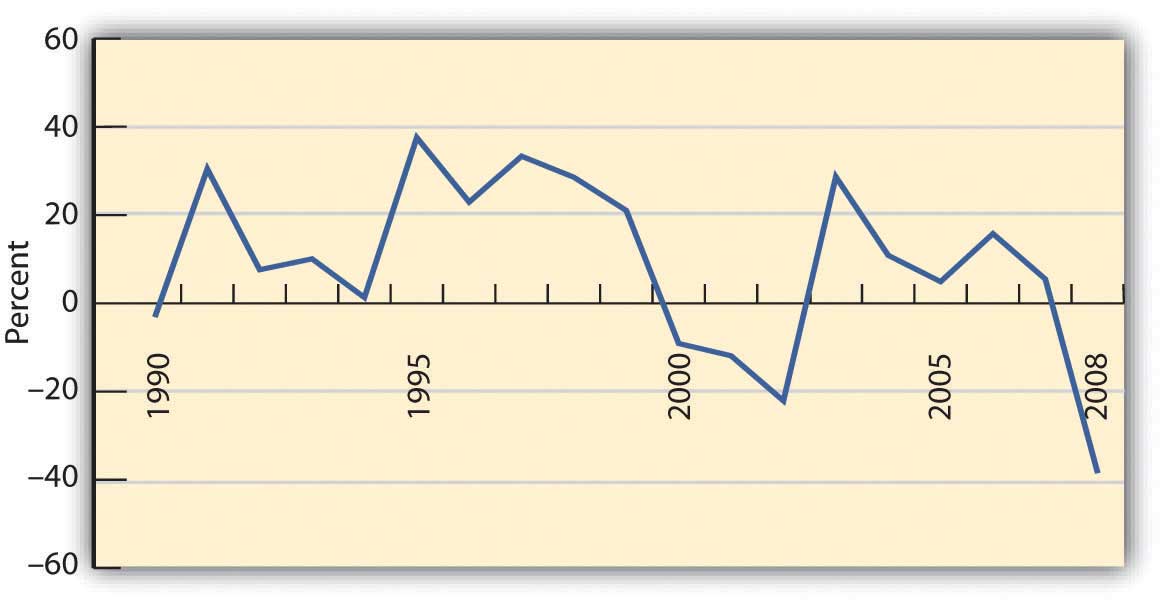
If the time period you are looking at is long enough, you can reasonably assume that an investment’s average return over time is the return you can expect in the next year. For example, if a company’s stock has returned, on average, 9 percent per year over the last twenty years, then if next year is an average year, that investment should return 9 percent again. Over the eighteen-year span from 1990 to 2008, for example, the average return for the S&P 500 was 9.16 percent. Unless you have some reason to believe that next year will not be an average year, the average return can be your expected return. The longer the time period you consider, the less volatility there will be in the returns, and the more accurate your prediction of expected returns will be.
Returns are the value created by an investment, through either income or gains. Returns are also your compensation for investing, for taking on some or all of the risk of the investment, whether it is a corporation, government, parcel of real estate, or work of art. Even if there is no risk, you must be paid for the use of liquidity that you give up to the investment (by investing).
Returns are the benefits from investing, but they must be larger than its costs. There are at least two costs to investing: the opportunity cost of giving up cash and giving up all your other uses of that cash until you get it back in the future and the cost of the risk you take—the risk that you won’t get it all back.
