
149 Estimate the Difference between Population Proportions (2 of 3)
Learning Objectives
- Construct a confidence interval to estimate the difference between two population proportions (or the size of a treatment effect) when conditions are met. Interpret the confidence interval in context.
- Interpret the meaning of a confidence level associated with a confidence interval and describe how the confidence level affects the margin of error.
- Given the description of a statistical study, evaluate whether conclusions are reasonable.
Confidence Interval for a Difference in Two Population Proportions: Beyond the Basics
For all confidence intervals, the margin of error is based on the standard error. We know from “Distributions of Differences in Sample Proportions” that the standard error for the sampling distribution of differences in sample proportions is:
[latex]\sqrt{\frac{{p}_{1}(1-{p}_{1})}{{n}_{1}}+\frac{{p}_{2}(1-{p}_{2})}{{n}_{2}}}[/latex]
Obviously, if we are trying to estimate the difference in population proportions, we will not know [latex]{p}_{1}[/latex] or [latex]{p}_{2}[/latex]. So we estimate these population proportions with our sample proportions. This is the same approach we used when had to estimate the standard error for the distribution of sample proportions in Inference for One Proportion. The estimated standard error becomes
[latex]\sqrt{\frac{{\stackrel{ˆ}{p}}_{1}(1-{\stackrel{ˆ}{p}}_{1})}{{n}_{1}}+\frac{{\stackrel{ˆ}{p}}_{2}(1-{\stackrel{ˆ}{p}}_{2})}{{n}_{2}}}[/latex]
This formula estimates the average error between a difference in sample proportions and the true difference in population proportions.
So a 95% confidence interval has the following formula:
[latex](\mathrm{difference}\text{}\mathrm{in}\text{}\mathrm{sample}\text{}\mathrm{proportions})\text{}±\text{}2(\mathrm{standard}\text{}\mathrm{error})[/latex]
[latex]({\stackrel{ˆ}{p}}_{1}-{\stackrel{ˆ}{p}}_{2})\text{}±\text{}2\sqrt{\frac{{\stackrel{ˆ}{p}}_{1}(1-{\stackrel{ˆ}{p}}_{1})}{{n}_{1}}+\frac{{\stackrel{ˆ}{p}}_{2}(1-{\stackrel{ˆ}{p}}_{2})}{{n}_{2}}}[/latex]
We can use this formula only if a normal model is a good fit for the sampling distribution. Recall that this is true only if the expected number of successes and failures in each sample is at least 10. For those who like formulas, these conditions translate into the following inequalities.
[latex]{n}_{1}{p}_{1}≥10\text{ }{n}_{1}(1-{p}_{1})≥10\text{ }{n}_{2}{p}_{2}≥10\text{ }{n}_{2}(1-{p}_{2})≥10[/latex]
We have to adjust these conditions because we do not know the population proportions [latex]{p}_{1}[/latex] and [latex]{p}_{2}[/latex]. We make the same adjustment we made in Inference for One Proportion. We require that the actual number of successes and failures in each sample is at least 10. For those who like formulas, these conditions translate into replacing [latex]{p}_{1}[/latex] and [latex]{p}_{2}[/latex] with the corresponding sample proportions. Luckily, this tweak works and the normal distribution still gives fairly accurate confidence levels for different critical z-scores.
Learn By Doing
Nicotine Replacement Therapy
The Centre for Addiction and Mental Health in Canada posted the following description of a clinical trial on clinicaltrials.gov in September 2011.
- This study will examine the efficacy of mailed distribution of free Nicotine Replacement Therapy to smokers. Telephone numbers will be randomly selected from across Canada in order to recruit adult smokers interested in completing a smoking survey and willing to be interviewed again in 8 weeks and 6 months times. Study participants will be asked about their smoking history and a hypothetical question: would they be interested in receiving the nicotine patch if this were to be provided to them free of charge? Participants expressing interest will be randomly assigned to one of two groups. One group will be offered the opportunity to actually receive a program of 5 weeks of nicotine patch for free right away and the other group will not be offered the free nicotine patches. The proportions of smokers in the two groups who quit smoking by the 6-month interview will be compared.
Learn By Doing
Other Levels of Confidence
In Inference for One Proportion, we saw that we can create confidence intervals for other levels of confidence. Changing the level of confidence changes the critical z-score. The following image shows the three most commonly used confidence levels and their critical z-scores.
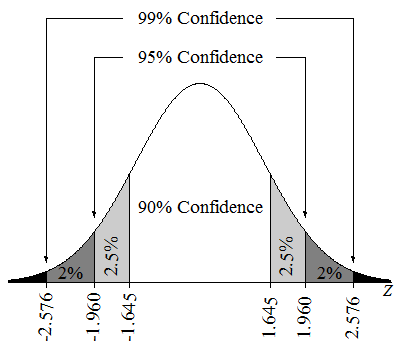
The following table summarizes the critical values for the most commonly used confidence levels.
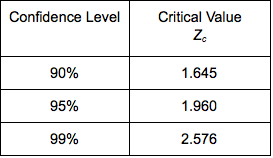
Note: A more exact value for the margin of error of a 95% confidence interval uses Zc = 1.96 instead of 2 standard errors.
Learn By Doing
Learn By Doing
What Is the Effect of Increasing the Confidence Level on the Margin of Error?
In an article titled “The Patriotism God Gap: Is the U.S. the Greatest Country in the World?” (Christianity Today, August 5, 2011), Tobin Grant cites data from the Pew Research Center. Here is an excerpt from the article:
- About 40 percent of other Christians [non-evangelicals] said the U.S. stands alone as the greatest country. Those with no religion stand out as being much less likely to see the U.S. as the greatest country. Only 20 percent said the U.S. was the best country in the world.
The article does not give the sample sizes for these two groups. For this activity, let’s suppose the data describes random samples of 500 from the populations of “other Christians” and those with “no religion.” With samples this large, we can safely model the sampling distribution of sample differences with a normal curve.
Use the simulation to find the margin of error for the 90%, 95%, and 99% confidence intervals. (Note: Conditions for use of the confidence interval formula are met because the sample size is large.)
