9 1.5 Nutrition Research Statistics
One important aspect in being able to interpret research is to have a basic understanding of statistical significance. Statistical significance means that there is sufficient statistical evidence to suggest that the results are most likely not due to chance.
Statistical significance is represented by p-values in most research. The p-value is an estimate of whether the difference is a statistical accident or due to random chance. A p-value of less than 0.05 (commonly written p-value <0.05 or p <0.05) is used in most cases to indicate statistical significance. This value means that 5% of the time the statistical results are accidental or not true. Researchers accept this level of uncertainty.
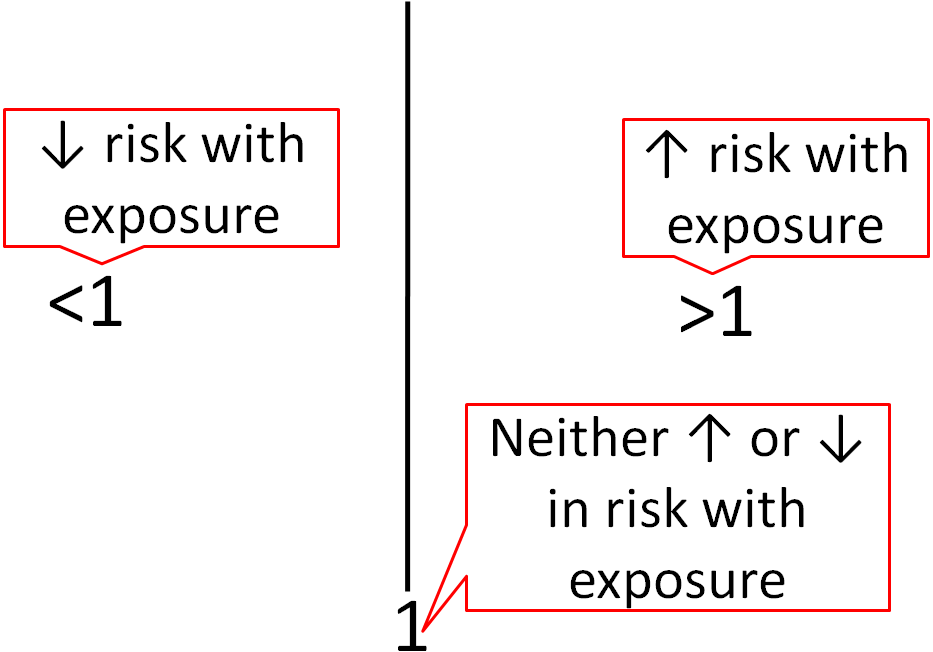
Epidemiological research usually uses different statistics to analyze their results. Epidemiological results are commonly reported as odds ratios (ORs), relative risks (RRs), or hazard ratios (HRs). These values can be interpreted similarly regardless of which is used. For example, the odds ratio represents the odds of a certain event occurring (often a disease) in response to a certain exposure (in nutrition this is often a food or dietary compound). In a paper it is common to see one of these measures in this form: OR = 2.0. What does this mean? As shown below, an OR, RR, or HR of 1 means that exposure is associated with neither increased nor decreased risk (neutral). If an OR, RR or HR is less than 1, that exposure is associated with a decreased risk. If an OR, RR, or HR is greater than 1, that exposure is associated with an increased risk. An OR,RR, or HR of 2 means there is twice the risk, while an OR, RR, or HR of 0.5 means there is half the risk of the exposure versus the comparison group.

To determine whether OR, RR, and HR are significantly different for a given exposure, most epidemiological research uses 95% confidence intervals. Confidence intervals indicate the estimated range that the measure is calculated to include. They go below and above the OR, RR, and HR itself. It is a calculation of how confident the researchers are that the OR, RR, and HR value is correct. Thus:
Large Confidence Intervals = Less Confidence in Value
Small Confidence Intervals = More Confidence in Value
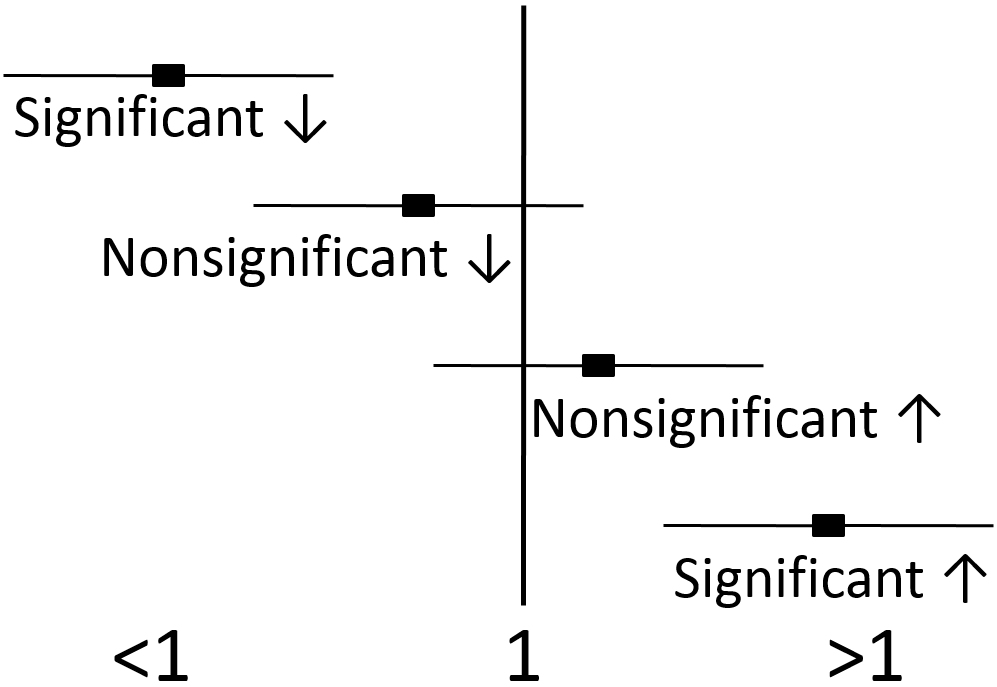
Thus, 95% confidence intervals indicate that researchers are 95% confident that the true value is within the confidence intervals. A confidence interval is normally written in parenthesis following the OR, RR, or HR or represented as bars in a figure as shown below.

Most of the time, the OR, RR, or HR will be found in the middle of the 95% confidence interval, but not necessarily all of the time. For instance, there could be much greater confidence that the value is not much lower than the OR, RR, or HR, but not much confidence that the value does not exceed the HR, RR, or HR. This could lead to confidence interval looking skewed above the OR, RR, or HR (more confidence interval above, than below, the OR, RR, or HR).
If the 95% confidence intervals of the OR, RR, or HR does not include or overlap 1, then the value is significant. If the 95% confidence intervals include or overlap 1, then the OR, RR, or HR is not significant, because it is possible the the true value is 1, which is neutral, and can not be significantly different than 1.

No References

