28 Nerve Conduction–Electrocardiograms

Learning Objectives

By the end of this section, you will be able to:

  • Explain the process by which electric signals are transmitted along a neuron.
  • Explain the effects myelin sheaths have on signal propagation.
  • Explain what the features of an ECG signal indicate.

Nerve Conduction

Electric currents in the vastly complex system of billions of nerves in our body allow us to sense the world, control parts of our body, and think. These are representative of the three major functions of nerves. First, nerves carry messages from our sensory organs and others to the central nervous system, consisting of the brain and spinal cord. Second, nerves carry messages from the central nervous system to muscles and other organs. Third, nerves transmit and process signals within the central nervous system. The sheer number of nerve cells and the incredibly greater number of connections between them makes this system the subtle wonder that it is. Nerve conduction is a general term for electrical signals carried by nerve cells. It is one aspect of bioelectricity, or electrical effects in and created by biological systems. Nerve cells, properly called neurons, look different from other cells—they have tendrils, some of them many centimeters long, connecting them with other cells. (See Figure 1.) Signals arrive at the cell body across synapses or through dendrites, stimulating the neuron to generate its own signal, sent along its long axon to other nerve or muscle cells. Signals may arrive from many other locations and be transmitted to yet others, conditioning the synapses by use, giving the system its complexity and its ability to learn.

The figure describes a neuron. The neuron has a cell body with a nucleus at the center represented by a circle. The cell body is surrounded by many thin, branching projections called dendrites, represented by ribbon-like structures. The ends of some of these dendrites are shown connected to the ends of dendrites from another neuron at junctions called synapses. The cell body of the neuron also has a long projection called an axon, represented as a vertical tube reaching downward and ending with thin projections inside a muscle fiber, represented by a tubular structure. The ends of the axon are called nerve endings. The axon is covered with myelin sheaths, each of which is one millimeter in length. The myelin sheaths are separated by gaps, called nodes of Ranvier, each of length zero point zero zero one millimeter.
Figure 1. A neuron with its dendrites and long axon. Signals in the form of electric currents reach the cell body through dendrites and across synapses, stimulating the neuron to generate its own signal sent down the axon. The number of interconnections can be far greater than shown here.

The method by which these electric currents are generated and transmitted is more complex than the simple movement of free charges in a conductor, but it can be understood with principles already discussed in this text. The most important of these are the Coulomb force and diffusion. Figure 2 illustrates how a voltage (potential difference) is created across the cell membrane of a neuron in its resting state. This thin membrane separates electrically neutral fluids having differing concentrations of ions, the most important varieties being Na+, K+, and Cl (these are sodium, potassium, and chlorine ions with single plus or minus charges as indicated). As discussed in Molecular Transport Phenomena: Diffusion, Osmosis, and Related Processes, free ions will diffuse from a region of high concentration to one of low concentration. But the cell membrane is semipermeable, meaning that some ions may cross it while others cannot. In its resting state, the cell membrane is permeable to K+ and Cl, and impermeable to Na+. Diffusion of K+ and Cl thus creates the layers of positive and negative charge on the outside and inside of the membrane. The Coulomb force prevents the ions from diffusing across in their entirety. Once the charge layer has built up, the repulsion of like charges prevents more from moving across, and the attraction of unlike charges prevents more from leaving either side. The result is two layers of charge right on the membrane, with diffusion being balanced by the Coulomb force. A tiny fraction of the charges move across and the fluids remain neutral (other ions are present), while a separation of charge and a voltage have been created across the membrane.

The semipermeable membrane of a cell is shown, with different concentrations of potassium cations, sodium cations, and chloride anions inside and outside the cell. The ions are represented by small, colored circles. In its resting state, the cell membrane is permeable to potassium and chloride ions, but it is impermeable to sodium ions. By diffusion, potassium cations travel out of the cell, going through the cell membrane and forming a layer of positive charge on the outer surface of the membrane. By diffusion, chloride anions go into the cell, going through the cell membrane and forming a layer of negative charge on the inner surface of the membrane. As a result, a voltage is set up across the cell membrane. The Coulomb force prevents all the ions from crossing the membrane.
Figure 2. The semipermeable membrane of a cell has different concentrations of ions inside and out. Diffusion moves the K+ and Cl ions in the direction shown, until the Coulomb force halts further transfer. This results in a layer of positive charge on the outside, a layer of negative charge on the inside, and thus a voltage across the cell membrane. The membrane is normally impermeable to Na+.
This is a graphical representation of a pulse of voltage, or action potential, inside a nerve cell. The voltage in millivolts is plotted along the vertical axis and the time in milliseconds is plotted along the horizontal axis. Initially, between zero and about two point eight milliseconds, the voltage is a constant at about minus ninety millivolts, corresponding to the resting state. Above this section of the graph, a window shows a small cross-section of the cell membrane, with a positively charged outer surface, a negatively charged inner surface, and no ions moving across the membrane. Between two point eight and four point two milliseconds, the voltage increases to a peak of fifty millivolts, corresponding to depolarization of the membrane. A window above this section shows sodium cations crossing the membrane, from outside to inside the cell, so that the membrane’s inner surface acquires a positive charge and its outer surface has a negative charge. Between about four point two and about five point five milliseconds, the voltage drops to a low of about minus one hundred and ten millivolts, corresponding to repolarization of the membrane. A window above this section shows potassium cations crossing the membrane, from inside to outside the cell, so that the membrane’s outer surface again acquires a positive charge and its inner surface has a negative charge. After that, the voltage rises slightly, going back to a constant of about minus ninety millivolts, corresponding to the resting state. This movement of sodium and potassium ions across the membrane is called active transport, and long-term active transport is shown in a window above the final part of the curve.
Figure 3. An action potential is the pulse of voltage inside a nerve cell graphed here. It is caused by movements of ions across the cell membrane as shown. Depolarization occurs when a stimulus makes the membrane permeable to Na+ ions. Repolarization follows as the membrane again becomes impermeable to Na+, and K+ moves from high to low concentration. In the long term, active transport slowly maintains the concentration differences, but the cell may fire hundreds of times in rapid succession without seriously depleting them.

The separation of charge creates a potential difference of 70 to 90 mV across the cell membrane. While this is a small voltage, the resulting electric field (V/d) across the only 8-nm-thick membrane is immense (on the order of 11 MV/m!) and has fundamental effects on its structure and permeability. Now, if the exterior of a neuron is taken to be at 0 V, then the interior has a resting potential of about –90 mV. Such voltages are created across the membranes of almost all types of animal cells but are largest in nerve and muscle cells. In fact, fully 25% of the energy used by cells goes toward creating and maintaining these potentials.

Electric currents along the cell membrane are created by any stimulus that changes the membrane’s permeability. The membrane thus temporarily becomes permeable to Na+, which then rushes in, driven both by diffusion and the Coulomb force. This inrush of Na+ first neutralizes the inside membrane, or depolarizes it, and then makes it slightly positive. The depolarization causes the membrane to again become impermeable to Na+, and the movement of K+ quickly returns the cell to its resting potential, or repolarizes it. This sequence of events results in a voltage pulse, called the action potential. (See Figure 3.) Only small fractions of the ions move, so that the cell can fire many hundreds of times without depleting the excess concentrations of Na+ and K+. Eventually, the cell must replenish these ions to maintain the concentration differences that create bioelectricity. This sodium-potassium pump is an example of active transport, wherein cell energy is used to move ions across membranes against diffusion gradients and the Coulomb force.

The action potential is a voltage pulse at one location on a cell membrane. How does it get transmitted along the cell membrane, and in particular down an axon, as a nerve impulse? The answer is that the changing voltage and electric fields affect the permeability of the adjacent cell membrane, so that the same process takes place there. The adjacent membrane depolarizes, affecting the membrane further down, and so on, as illustrated in Figure 4. Thus the action potential stimulated at one location triggers a nerve impulse that moves slowly (about 1 m/s) along the cell membrane.

The figure describes the propagation of an action potential, or voltage pulse, along a cell membrane. The cell membrane, represented by a horizontal, blue strip, is shown in five stages, with the electrical signal moving along its length from left to right. Initially, the membrane is in the resting state, with a uniform distribution of positive charges along the outer surface and negative charges along the inner surface. A sodium cation is shown outside the cell, and a potassium cation is shown inside the cell. A small part of the membrane near the left end receives a stimulus, making that part permeable to sodium ions. In the second stage, sodium ions cross the membrane in that area, represented by a white opening in the membrane. The charge distribution in that section of the membrane is reversed; this process is called depolarization. At the same time, an adjacent part of the membrane is stimulated. In the third stage, the depolarized area undergoes repolarization, with potassium ions crossing the membrane from inside to outside the cell. Repolarization is represented by a box containing tiny triangles. At the same time, sodium ions enter the cell through the adjacent area that was stimulated in the second stage. As the cycle is repeated, the electrical signal moves along the membrane, from left to right.
Figure 4. A nerve impulse is the propagation of an action potential along a cell membrane. A stimulus causes an action potential at one location, which changes the permeability of the adjacent membrane, causing an action potential there. This in turn affects the membrane further down, so that the action potential moves slowly (in electrical terms) along the cell membrane. Although the impulse is due to Na+ and K+ going across the membrane, it is equivalent to a wave of charge moving along the outside and inside of the membrane.

Some axons, like that in Figure 1, are sheathed with myelin, consisting of fat-containing cells. Figure 5 shows an enlarged view of an axon having myelin sheaths characteristically separated by unmyelinated gaps (called nodes of Ranvier). This arrangement gives the axon a number of interesting properties. Since myelin is an insulator, it prevents signals from jumping between adjacent nerves (cross talk). Additionally, the myelinated regions transmit electrical signals at a very high speed, as an ordinary conductor or resistor would. There is no action potential in the myelinated regions, so that no cell energy is used in them. There is an IR signal loss in the myelin, but the signal is regenerated in the gaps, where the voltage pulse triggers the action potential at full voltage. So a myelinated axon transmits a nerve impulse faster, with less energy consumption, and is better protected from cross talk than an unmyelinated one. Not all axons are myelinated, so that cross talk and slow signal transmission are a characteristic of the normal operation of these axons, another variable in the nervous system.

The degeneration or destruction of the myelin sheaths that surround the nerve fibers impairs signal transmission and can lead to numerous neurological effects. One of the most prominent of these diseases comes from the body’s own immune system attacking the myelin in the central nervous system—multiple sclerosis. MS symptoms include fatigue, vision problems, weakness of arms and legs, loss of balance, and tingling or numbness in one’s extremities (neuropathy). It is more apt to strike younger adults, especially females. Causes might come from infection, environmental or geographic affects, or genetics. At the moment there is no known cure for MS.

Most animal cells can fire or create their own action potential. Muscle cells contract when they fire and are often induced to do so by a nerve impulse. In fact, nerve and muscle cells are physiologically similar, and there are even hybrid cells, such as in the heart, that have characteristics of both nerves and muscles. Some animals, like the infamous electric eel (see Figure 6), use muscles ganged so that their voltages add in order to create a shock great enough to stun prey.

The figure describes the propagation of a nerve impulse, or voltage pulse, down a myelinated axon, from left to right. A cross-section of the axon is shown as a long, horizontally oriented rectangular strip, with a membrane on each side. The axon is covered with myelin sheaths separated by gaps known as nodes of Ranvier. Three gaps are shown. Most of the inner surface of the membrane is negatively charged, and the outer surface is positively charged. The gap on the left is labeled as depolarized, where the charge distribution along the membrane surface is reversed. As the voltage pulse moves from left to right through the first myelinated region, it loses voltage. The gap in the middle, labeled as depolarizing, shows sodium cations crossing the membrane from the outside to the inside of the axon. This regenerates the voltage pulse, which continues to move along the axon. The third gap is labeled as still polarized, because the signal has yet to reach that gap.
Figure 5. Propagation of a nerve impulse down a myelinated axon, from left to right. The signal travels very fast and without energy input in the myelinated regions, but it loses voltage. It is regenerated in the gaps. The signal moves faster than in unmyelinated axons and is insulated from signals in other nerves, limiting cross talk.
Photograph of an electric eel.
Figure 6. An electric eel flexes its muscles to create a voltage that stuns prey. (credit: chrisbb, Flickr)

Electrocardiograms

Just as nerve impulses are transmitted by depolarization and repolarization of adjacent membrane, the depolarization that causes muscle contraction can also stimulate adjacent muscle cells to depolarize (fire) and contract. Thus, a depolarization wave can be sent across the heart, coordinating its rhythmic contractions and enabling it to perform its vital function of propelling blood through the circulatory system. Figure 7 is a simplified graphic of a depolarization wave spreading across the heart from the sinoarterial (SA) node, the heart’s natural pacemaker.

The figure shows that the charge distribution on the outer surface of the heart changes from positive to negative during depolarization. This wave of depolarization, spreading from the upper right toward the lower left of the heart, is represented by a vector pointing in the direction of the wave. The components of this vector are measured by placing electrodes on the patient’s chest. The figure shows three electrodes, labeled R A, L A, and L L, placed to form a triangle around the heart. The electrode R A is close to the right atrium, L A is close to the left atrium, and L L is just below the heart. R A and L A form a pair called lead one, R A and L L form a second pair called lead two, and L A and L L form a third pair called lead three. Each pair of electrodes measures a component of the depolarization vector.
Figure 7. The outer surface of the heart changes from positive to negative during depolarization. This wave of depolarization is spreading from the top of the heart and is represented by a vector pointing in the direction of the wave. This vector is a voltage (potential difference) vector. Three electrodes, labeled RA, LA, and LL, are placed on the patient. Each pair (called leads I, II, and III) measures a component of the depolarization vector and is graphed in an ECG.

An electrocardiogram (ECG) is a record of the voltages created by the wave of depolarization and subsequent repolarization in the heart. Voltages between pairs of electrodes placed on the chest are vector components of the voltage wave on the heart. Standard ECGs have 12 or more electrodes, but only three are shown in Figure 7 for clarity. Decades ago, three-electrode ECGs were performed by placing electrodes on the left and right arms and the left leg. The voltage between the right arm and the left leg is called the lead II potential and is the most often graphed. We shall examine the lead II potential as an indicator of heart-muscle function and see that it is coordinated with arterial blood pressure as well.

Heart function and its four-chamber action are explored in Viscosity and Laminar Flow; Poiseuille’s Law. Basically, the right and left atria receive blood from the body and lungs, respectively, and pump the blood into the ventricles. The right and left ventricles, in turn, pump blood through the lungs and the rest of the body, respectively. Depolarization of the heart muscle causes it to contract. After contraction it is repolarized to ready it for the next beat. The ECG measures components of depolarization and repolarization of the heart muscle and can yield significant information on the functioning and malfunctioning of the heart.

Figure 8 shows an ECG of the lead II potential and a graph of the corresponding arterial blood pressure. The major features are labeled P, Q, R, S, and T. The P wave is generated by the depolarization and contraction of the atria as they pump blood into the ventricles. The QRS complex is created by the depolarization of the ventricles as they pump blood to the lungs and body. Since the shape of the heart and the path of the depolarization wave are not simple, the QRS complex has this typical shape and time span. The lead II QRS signal also masks the repolarization of the atria, which occur at the same time. Finally, the T wave is generated by the repolarization of the ventricles and is followed by the next P wave in the next heartbeat. Arterial blood pressure varies with each part of the heartbeat, with systolic (maximum) pressure occurring closely after the QRS complex, which signals contraction of the ventricles.

This figure has two graphs, placed one below the other. The lower graph shows an E C G of the lead two potential, and the upper graph shows the corresponding changes in arterial blood pressure. In each case, time is plotted on the horizontal axis, in seconds. The vertical axis of the upper graph shows the arterial blood pressure in millimeters of mercury, and the vertical axis of the lower graph shows the lead two voltage in millivolts. The upper graph is roughly sinusoidal, showing the diastolic or minimum blood pressure at about eighty millimeters of mercury, and the systolic or maximum blood pressure at about one hundred twenty millimeters of mercury. For the lower graph, the main features are labeled P, Q, R, S, and T. The P wave is a smooth curve that rises from zero millivolts to a peak of about zero point two five millivolts and falls to just below zero millivolts when it reaches point Q. From point Q to point R, the voltage rises steeply to about one millivolt, and then drops equally sharply to point S, at negative zero point three millivolts. This is followed by the T wave, which is a smooth curve, broader than the P wave, with a peak of comparable height. All of this is completed in less than seven-tenths of a second, with the voltage returning to zero millivolts. After about one-tenth of a second, the cycle begins again. The systolic blood pressure follows soon after the QRS complex.
Figure 8. A lead II ECG with corresponding arterial blood pressure. The QRS complex is created by the depolarization and contraction of the ventricles and is followed shortly by the maximum or systolic blood pressure. See text for further description.

Taken together, the 12 leads of a state-of-the-art ECG can yield a wealth of information about the heart. For example, regions of damaged heart tissue, called infarcts, reflect electrical waves and are apparent in one or more lead potentials. Subtle changes due to slight or gradual damage to the heart are most readily detected by comparing a recent ECG to an older one. This is particularly the case since individual heart shape, size, and orientation can cause variations in ECGs from one individual to another. ECG technology has advanced to the point where a portable ECG monitor with a liquid crystal instant display and a printer can be carried to patients’ homes or used in emergency vehicles. See Figure 9.

Photograph of a NASA scientist in an underwater habitat recording her vital signs using a portable device and a laptop computer.
Figure 9. This NASA scientist and NEEMO 5 aquanaut’s heart rate and other vital signs are being recorded by a portable device while living in an underwater habitat. (credit: NASA, Life Sciences Data Archive at Johnson Space Center, Houston, Texas)

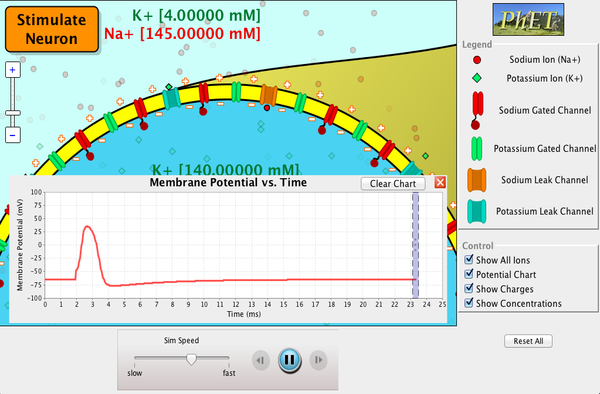
PhET Explorations: Neuron

Stimulate a neuron and monitor what happens. Pause, rewind, and move forward in time in order to observe the ions as they move across the neuron membrane.
Neuron screenshot.
Click to download the simulation. Run using Java.

Section Summary

  • Electric potentials in neurons and other cells are created by ionic concentration differences across semipermeable membranes.
  • Stimuli change the permeability and create action potentials that propagate along neurons.
  • Myelin sheaths speed this process and reduce the needed energy input.
  • This process in the heart can be measured with an electrocardiogram (ECG).

Conceptual Questions

1. Note that in Figure 2, both the concentration gradient and the Coulomb force tend to move Na+ ions into the cell. What prevents this?

The semipermeable membrane of a cell is shown, with different concentrations of potassium cations, sodium cations, and chloride anions inside and outside the cell. The ions are represented by small, colored circles. In its resting state, the cell membrane is permeable to potassium and chloride ions, but it is impermeable to sodium ions. By diffusion, potassium cations travel out of the cell, going through the cell membrane and forming a layer of positive charge on the outer surface of the membrane. By diffusion, chloride anions go into the cell, going through the cell membrane and forming a layer of negative charge on the inner surface of the membrane. As a result, a voltage is set up across the cell membrane. The Coulomb force prevents all the ions from crossing the membrane.
Figure 2. The semipermeable membrane of a cell has different concentrations of ions inside and out. Diffusion moves the K+ and Cl– ions in the direction shown, until the Coulomb force halts further transfer. This results in a layer of positive charge on the outside, a layer of negative charge on the inside, and thus a voltage across the cell membrane. The membrane is normally impermeable to Na+.

2. Define depolarization, repolarization, and the action potential.

3. Explain the properties of myelinated nerves in terms of the insulating properties of myelin.

Problems & Exercises

1. Integrated Concepts Use the ECG in Figure 8 to determine the heart rate in beats per minute assuming a constant time between beats.

This figure has two graphs, placed one below the other. The lower graph shows an E C G of the lead two potential, and the upper graph shows the corresponding changes in arterial blood pressure. In each case, time is plotted on the horizontal axis, in seconds. The vertical axis of the upper graph shows the arterial blood pressure in millimeters of mercury, and the vertical axis of the lower graph shows the lead two voltage in millivolts. The upper graph is roughly sinusoidal, showing the diastolic or minimum blood pressure at about eighty millimeters of mercury, and the systolic or maximum blood pressure at about one hundred twenty millimeters of mercury. For the lower graph, the main features are labeled P, Q, R, S, and T. The P wave is a smooth curve that rises from zero millivolts to a peak of about zero point two five millivolts and falls to just below zero millivolts when it reaches point Q. From point Q to point R, the voltage rises steeply to about one millivolt, and then drops equally sharply to point S, at negative zero point three millivolts. This is followed by the T wave, which is a smooth curve, broader than the P wave, with a peak of comparable height. All of this is completed in less than seven-tenths of a second, with the voltage returning to zero millivolts. After about one-tenth of a second, the cycle begins again. The systolic blood pressure follows soon after the QRS complex.
Figure 8. A lead II ECG with corresponding arterial blood pressure. The QRS complex is created by the depolarization and contraction of the ventricles and is followed shortly by the maximum or systolic blood pressure. See text for further description.


Integrated Concepts

(a) Referring to Figure 8, find the time systolic pressure lags behind the middle of the QRS complex. (b) Discuss the reasons for the time lag.

Glossary

nerve conduction:
the transport of electrical signals by nerve cells
bioelectricity:
electrical effects in and created by biological systems
semipermeable:
property of a membrane that allows only certain types of ions to cross it
electrocardiogram (ECG):
usually abbreviated ECG, a record of voltages created by depolarization and repolarization, especially in the heart

Selected Solutions to Problems & Exercises

1. 80 beats/minute


License

Icon for the Creative Commons Attribution 4.0 International License

Physics II Copyright © by Lumen Learning is licensed under a Creative Commons Attribution 4.0 International License, except where otherwise noted.

Share This Book