156 Introduction to Graphs of Logarithmic Functions
LEARNING OBJECTIVES
By the end of this lesson, you will be able to:
- Identify the domain of a logarithmic function.
- Graph logarithmic functions.
In Graphs of Exponential Functions, we saw how creating a graphical representation of an exponential model gives us another layer of insight for predicting future events. How do logarithmic graphs give us insight into situations? Because every logarithmic function is the inverse function of an exponential function, we can think of every output on a logarithmic graph as the input for the corresponding inverse exponential equation. In other words, logarithms give the cause for an effect.
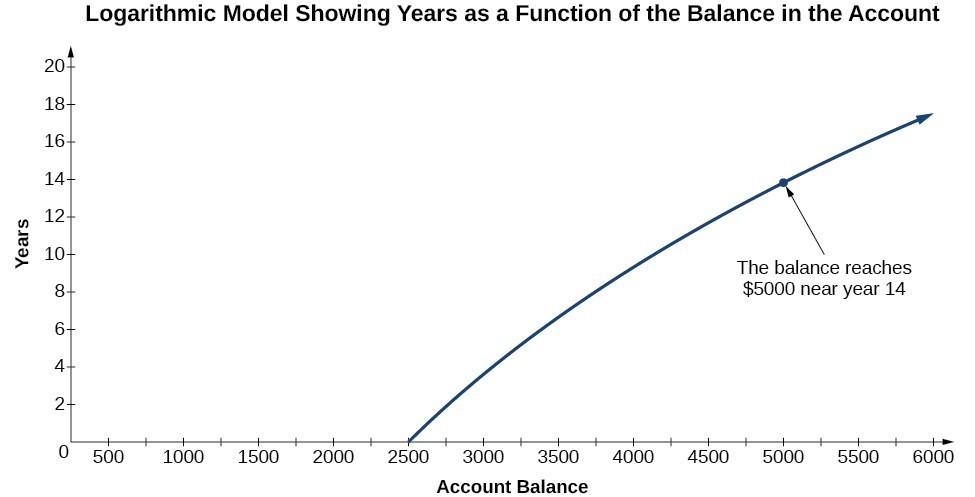
To illustrate, suppose we invest $2500 in an account that offers an annual interest rate of 5%, compounded continuously. We already know that the balance in our account for any year t can be found with the equation [latex]A=2500{e}^{0.05t}\\[/latex].
But what if we wanted to know the year for any balance? We would need to create a corresponding new function by interchanging the input and the output; thus we would need to create a logarithmic model for this situation. By graphing the model, we can see the output (year) for any input (account balance). For instance, what if we wanted to know how many years it would take for our initial investment to double? Figure 1 shows this point on the logarithmic graph.

In this section we will discuss the values for which a logarithmic function is defined, and then turn our attention to graphing the family of logarithmic functions.

