
278 Reading: Liquidity Trap
The Degree of Impact on the Economy
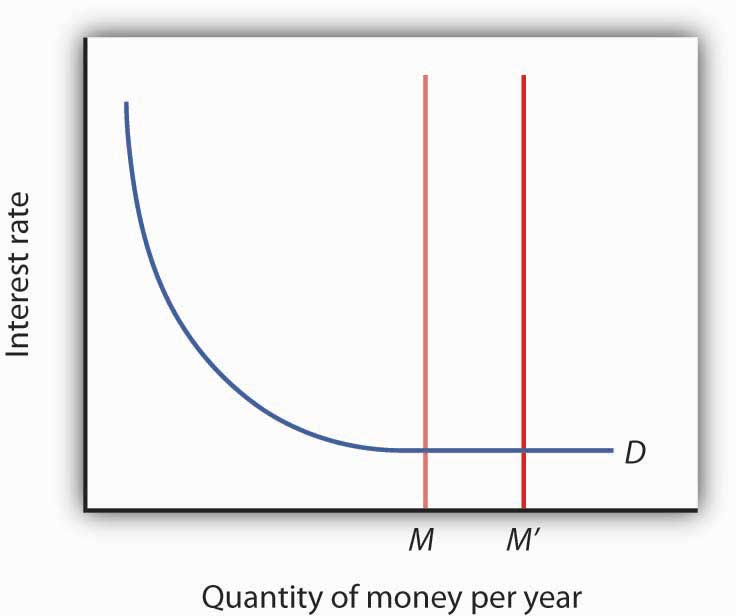
What if the Fed cannot bring about a change in interest rates? A liquidity trap is said to exist when a change in monetary policy has no effect on interest rates. This would be the case if the money demand curve were horizontal at some interest rate, as shown in Figure 11.5 “A Liquidity Trap.” If a change in the money supply from M to M′ cannot change interest rates, then, unless there is some other change in the economy, there is no reason for investment or any other component of aggregate demand to change. Hence, traditional monetary policy is rendered totally ineffective; its degree of impact on the economy is nil. At an interest rate of zero, since bonds cease to be an attractive alternative to money, which is at least useful for transactions purposes, there would be a liquidity trap.
With the federal funds rate in the United States close to zero at the end of 2008, the possibility that the country is in or nearly in a liquidity trap cannot be dismissed. As discussed in the introduction to the chapter, at the same time the Fed lowered the federal funds rate to close to zero, it mentioned that it intended to pursue additional, nontraditional measures. What the Fed seeks to do is to make firms and consumers want to spend now by using a tool not aimed at reducing the interest rate, since it cannot reduce the interest rate below zero. It thus shifts its focus to the price level and to avoiding expected deflation. For example, if the public expects the price level to fall by 2% and the interest rate is zero, by holding money, the money is actually earning a positive real interest rate of 2%—the difference between the nominal interest rate and the expected deflation rate. Since the nominal rate of interest cannot fall below zero (Who would, for example, want to lend at an interest rate below zero when lending is risky whereas cash is not? In short, it does not make sense to lend $10 and get less than $10 back.), expected deflation makes holding cash very attractive and discourages spending since people will put off purchases because goods and services are expected to get cheaper.
To combat this “wait-and-see” mentality, the Fed or other central bank, using a strategy referred to as quantitative easing, must convince the public that it will keep interest rates very low by providing substantial reserves for as long as is necessary to avoid deflation. In other words, it is aimed at creating expected inflation. For example, at the Fed’s October 2003 meeting, it announced that it would keep the federal funds rate at 1% for “a considerable period.” When the Fed lowered the rate to between 0% and 0.25% in December 2008, it added that “the Committee anticipates that weak economic conditions are likely to warrant exceptionally low levels of the federal funds rate for some time.” After working so hard to convince economic players that it will not tolerate inflation above 2%, the Fed must now convince the public that it will, but of course not too much! If it is successful, this extraordinary form of expansionary monetary policy will lead to increased purchases of goods and services, compared to what they would have been with expected deflation. Also, by providing banks with lots of liquidity, it is hoping to encourage them to lend.
The Japanese economy provides an interesting modern example of a country that attempted quantitative easing. With a recessionary gap starting in the early 1990s and deflation in most years from 1995 on, Japan’s central bank, the Bank of Japan, began to lower the call money rate (equivalent to the federal funds rate in the United States), reaching near zero by the late 1990s. With growth still languishing, Japan appeared to be in a traditional liquidity trap. In late 1999, the Bank of Japan announced that it would maintain a zero interest rate policy for the foreseeable future, and in March 2001 it officially began a policy of quantitative easing. In 2006, with the price level rising modestly, Japan ended quantitative easing and began increasing the call rate again. It should be noted that the government simultaneously engaged in expansionary fiscal policy.
How well did these policies work? The economy began to grow modestly in 2003, though deflation between 1% and 2% remained. Some researchers feel that the Bank of Japan ended quantitative easing too early. Also, delays in implementing the policy, as well as delays in restructuring the banking sector, exacerbated Japan’s problems.
Former Fed Chairman Bernanke and other Fed officials have argued that the Fed is also engaged in credit easing. Credit easing is a strategy that involves the extension of central bank lending to influence more broadly the proper functioning of credit markets and to improve liquidity. In general, the Fed is hoping that these new credit facilities will improve liquidity in a variety of credit markets, ranging from those used by money market mutual funds to those involved in student and car loans.
Self Check: Liquidity Trap
Answer the question(s) below to see how well you understand the topics covered in the previous section. This short quiz does not count toward your grade in the class, and you can retake it an unlimited number of times.
You’ll have more success on the Self Check if you’ve completed the two Readings in this section.
Use this quiz to check your understanding and decide whether to (1) study the previous section further or (2) move on to the next section.
