60 Worked Example: Shift in Supply

Shift in Supply Due to Production-Cost Increase
We know that a supply curve shows the minimum price a firm will accept to produce a given quantity of output. What happens to the supply curve when the cost of production goes up? Following is an example of a shift in supply due to an increase in production cost.
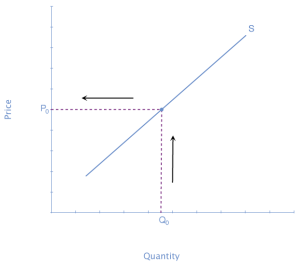
Step 1. Draw a graph of a supply curve for pizza. Pick a quantity (like Q0). If you draw a vertical line up from Q0 to the supply curve, you will see the price the firm chooses. An example is shown in Figure 1.
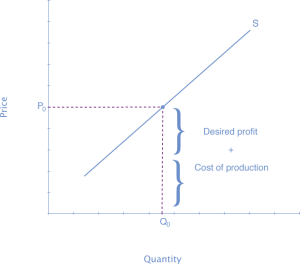
Step 2. Why did the firm choose that price and not some other? One way to think about this is that the price is composed of two parts. The first part is the average cost of production: in this case, the cost of the pizza ingredients (dough, sauce, cheese, pepperoni, and so on), the cost of the pizza oven, the rent on the shop, and the wages of the workers. The second part is the firm’s desired profit, which is determined, among other factors, by the profit margins in that particular business. If you add these two parts together, you get the price the firm wishes to charge. The quantity Q0 and associated price P0 give you one point on the firm’s supply curve, as shown in Figure 2.
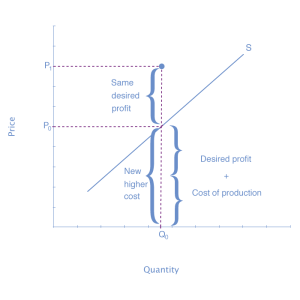
Step 3. Now, suppose that the cost of production goes up. Perhaps cheese has become more expensive by $0.75 per pizza. If that is true, the firm will want to raise its price by the amount of the increase in cost ($0.75). Draw this point on the supply curve directly above the initial point on the curve, but $0.75 higher, as shown in Figure 3.
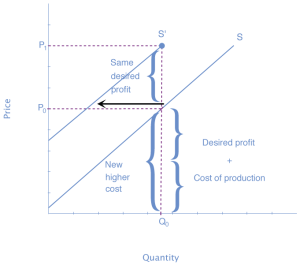
Step 4. Shift the supply curve through this point. You will see that an increase in cost causes a leftward shift of the supply curve so that at any price, the quantities supplied will be smaller, as shown in Figure 4.