
58 Reading: What Is Supply?

Supply of Goods and Services
When economists talk about supply, they mean the amount of some good or service a producer is willing to supply at each price. Price is what the producer receives for selling one unit of a good or service. A rise in price almost always leads to an increase in the quantity supplied of that good or service, while a fall in price will decrease the quantity supplied. When the price of gasoline rises, for example, it encourages profit-seeking firms to take several actions: expand exploration for oil reserves; drill for more oil; invest in more pipelines and oil tankers to bring the oil to plants where it can be refined into gasoline; build new oil refineries; purchase additional pipelines and trucks to ship the gasoline to gas stations; and open more gas stations or keep existing gas stations open longer hours. Economists call this positive relationship between price and quantity supplied—that a higher price leads to a higher quantity supplied and a lower price leads to a lower quantity supplied—the law of supply. The law of supply, like the law of demand, assumes that all other variables that affect supply (to be explained in the next reading) are held equal.
Supply vs. Quantity Supplied
In economic terminology, supply is not the same as quantity supplied. When economists refer to supply, they mean the relationship between a range of prices and the quantities supplied at those prices, a relationship that can be illustrated with a supply curve or a supply schedule. When economists refer to quantity supplied, they mean only a certain point on the supply curve, or one quantity on the supply schedule. In short, supply refers to the curve, and quantity supplied refers to the (specific) point on the curve.
Figure 1, below, illustrates the law of supply, again using the market for gasoline as an example. Like demand, supply can be illustrated using a table or a graph. A supply schedule is a table—like Table 1, below—that shows the quantity supplied at a range of different prices. Again, price is measured in dollars per gallon of gasoline, and quantity demanded is measured in millions of gallons. A supply curve is a graphic illustration of the relationship between price, shown on the vertical axis, and quantity, shown on the horizontal axis. You can see from this curve (Figure 1) that as the price rises, quantity supplied also increases and vice versa. The supply schedule and the supply curve are just two different ways of showing the same information. Notice that the horizontal and vertical axes on the graph for the supply curve are the same as for the demand curve.
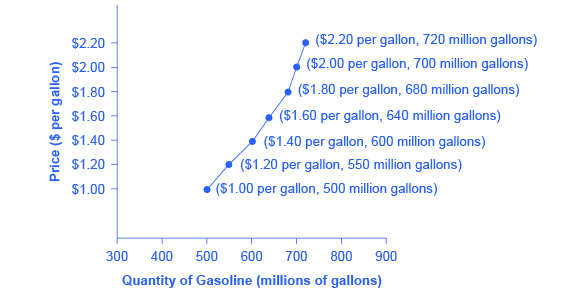
Table 1. Price and Supply of Gasoline
| Price (per gallon) | Quantity Supplied (millions of gallons) |
|---|---|
| $1.00 | 500 |
| $1.20 | 550 |
| $1.40 | 600 |
| $1.60 | 640 |
| $1.80 | 680 |
| $2.00 | 700 |
| $2.20 | 720 |
The shape of supply curves will vary somewhat according to the product: steeper, flatter, straighter, or curved. Nearly all supply curves, however, share a basic similarity: They slope up from left to right and illustrate the law of supply. As the price rises, say, from $1.00 per gallon to $2.20 per gallon, the quantity supplied increases from 500 gallons to 720 gallons. Conversely, as the price falls, the quantity supplied decreases.
The Law of Supply Video
The law of supply states that more of a good will be provided the higher its price; less will be provided the lower its price, ceteris paribus. There is a direct relationship between price and quantity supplied.
