
79 Reading: Polar Cases of Elasticity

Polar Cases of Elasticity
There are two extreme cases of elasticity: when elasticity equals zero and when it’s infinite. We will describe each case.
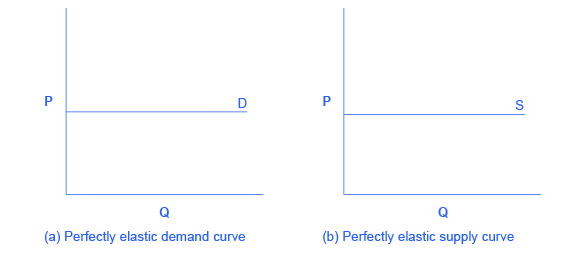
Infinite elasticity or perfect elasticity refers to the extreme case in which either the quantity demanded (Qd) or supplied (Qs) changes by an infinite amount in response to any change in price at all. In both cases, the supply curve and the demand curve are horizontal, as shown in Figure 1, below.
Perfectly elastic supply is unrealistic; however, the curve can be explained using a little imagination. If supply is perfectly elastic, it means that any change in price will result in an infinite amount of change in quantity. Suppose that you baked delicious cookies and your costs, including inputs and time, were $3 per cookie. At $3, you would be willing to sell as many cookies as you could. You would not sell a single cookie if the price were any lower than $3, and if price were above $3, you would sell an infinite amount. In summary, your supply curve would be perfectly elastic at a price of $3, and any change in price would result in a change in quantity supplied to infinity or zero, depending on whether price increased or decreased, respectively.
Similarly, perfectly elastic demand is an extreme example. Perfect elastic demand means that quantity demanded will increase to infinity when the price decreases, and quantity demanded will decrease to zero when price increases. When consumers are extremely sensitive to changes in price, you can think about perfectly elastic demand as “all or nothing.” For example, if the price of cruises to the Caribbean decreased, everyone would buy tickets (i.e., quantity demanded would increase to infinity), and if the price of cruises to the Caribbean increased, not a single person would be on the boat (i.e., quantity demanded would decrease to zero).
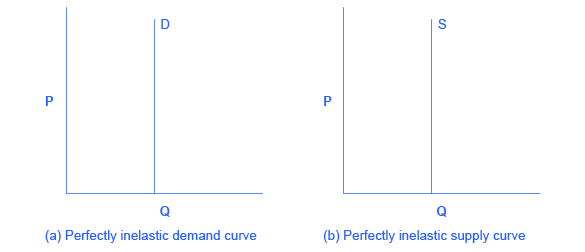
Zero elasticity or perfect inelasticity, as depicted in Figure 2, refers to the extreme case in which a percentage change in price, no matter how large, results in zero change in quantity supplied or demanded.
While a perfectly inelastic supply is an extreme example, goods with limited supply of inputs are likely to feature highly inelastic supply curves. Consider housing in prime locations such as apartments facing Central Park in New York City or beachfront property in Southern California. If housing prices increase for beachfront property in Southern California, there is a fixed amount of land, and only so many houses can be squeezed in along the beach. If housing prices decrease for Central Park–facing apartments, sellers are not going to bulldoze the buildings. Perfectly inelastic supply means that quantity supplied remains the same when price increases or decreases. Sellers are completely unresponsive to changes in price.
Similarly, while perfectly inelastic demand is an extreme case, necessities with no close substitutes are likely to have highly inelastic demand curves. This is the case with life-saving prescription drugs, for example. Consider a person with kidney failure who needs insulin to stay alive. A specific quantity of insulin is prescribed to the patient. If the price of insulin decreases, the patient can’t stock up and save it for the future. If the price of insulin increases, the patient will continue to purchase the same quantity needed to stay alive. Perfectly inelastic demand means that quantity demanded remains the same when price increases or decreases. Consumers are completely unresponsive to changes in price.
Self Check: Calculating Price Elasticity
Answer the question(s) below to see how well you understand the topics covered in the previous section. This short quiz does not count toward your grade in the class, and you can retake it an unlimited number of times.
You’ll have more success on the Self Check if you’ve completed the four Readings in this section.
Use this quiz to check your understanding and decide whether to (1) study the previous section further or (2) move on to the next section.
