
103 H1.02: Example 1
Example 1: During the first and second quarters of a year, a business had sales of $42,000 and $58,000, respectively. If the growth of sales follows a linear pattern for the next four years, what will sales be in the fourth quarter? In the 9th quarter? Use an algebraic method of solution.
Solution:
1. What are the two variables and their units?
Ans. Quarter and sales. Quarter is in numbers and sales are in dollars.
2. What will we predict? (Make it y.) What are the limits? What are some points?
Ans. We will predict sales. So y = sales. Then x = quarter and x will go from 1 to 16, in increments of 1.
Quarter 1 has sales of 42,000. So x = 1 and y = 42000. Use the point (1, 42000)
Quarter 2 has sales of 58,000. So x = 2 and y = 58000. Use the point (2, 58000)
3. Is a linear model appropriate?
We are told to use a linear model here to see what it would predict.
4. Slope: Find the slope: m = rise / run
Let (1,42000) be the first point and (2, 58000) be the second point.
[latex]m=\frac{{{y}_{2}}-{{y}_{1}}}{{{x}_{2}}-{{x}_{1}}}=\frac{58000-42000}{2-1}=\frac{16000}{1}=16000[/latex]
Interpret the slope, using the units of the numbers in the problem:
(As x increases by 1, y increases by m.)
For each quarter that goes by, sales will increase by $16,000.
5. Write the formula of the linear relationship:
(Choose either point and use the point-slope form of the line. Then simplify it to the slope-intercept form of the line.)
Choose (1,42000) for the point and use the slope of 16000 that was just computed.
[latex]\begin{align}&\text{}y-{{y}_{0}}=m(x-{{x}_{0}})\\&\,\,\,\,\,\,\,\,\,\,\,\,\,\,\,\,\,\,y-42000=16000(x-1)\\&\,\,\,\,\,\,\,\,\,\,\,\,\,\,\,\,\,\,y-42000=16000x-16000\\&y-42000+42000=16000x-16000+42000\\&\,\,\,\,\,\,\,\,\,\,\,\,\,\,\,\,\,\,\,\,\,\,\,\,\,\,\,\,\,\,\,\,\,\,\,\,y=16000x+26000\\\end{align}[/latex]
6. Interpret the y-intercept.
(The value of y is b when .)
For quarter 0, the sales would be $26,000. This isn’t meaningful because the quarters start with the first quarter in this problem, not the zero-th quarter.
7. Use the formula to make the requested prediction. Write the result in a sentence, with units.
For the fourth quarter, [latex]x=4[/latex].
[latex]\begin{align}&y=16000x+26000\\&y=16000(4)+26000\\&y=64000+26000\\&y=90000\end{align}[/latex]
So, in the fourth quarter, the linear model predicts sales of $90,000.
In a similar manner, for the 9th quarter, the linear model predicts sales of $170,000, because y = 16000(9)+26000 = 170000
8. Sketch a graph from the original problem information, use it to estimate the answers to the prediction questions, and determine whether your answers from the algebraic formula are reasonable.
| quarter | sales |
| 1 | 42000 |
| 2 | 58000 |
By hand, we plot these points, draw the line, and then extend it far enough to use it to estimate the answers to the questions.
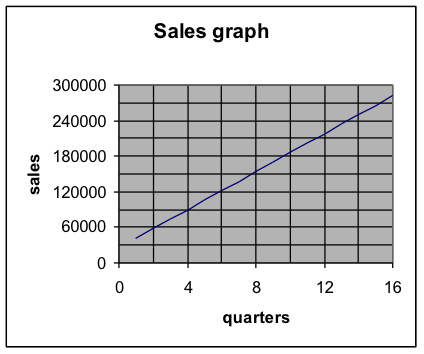
On this graph, we see that, when quarters = 4, the y-value is 90,000.
We also see that when quarters = 9, the y-value is $170,000.
So the answers from the graph are consistent with the answers we by doing the algebra and arithmetic using the formula.
These two answers for the predictions are reasonable.
