
127 J1.08: Section 3
Section 3: Choosing a trial model based on the pattern of the data graph
In most cases, it will not be difficult to decide which type of model will best fit the trendline of the data. Each type of model has its own characteristics, which usually means that only one of them, if any, will be capable of fitting the data well. If you identify a good candidate for a model, you can test it by using the appropriate worksheet to find its best-fit parameters and see how good the match is. If no model you know of fits the data, explain what aspect of the data pattern lets you know that model won’t work.
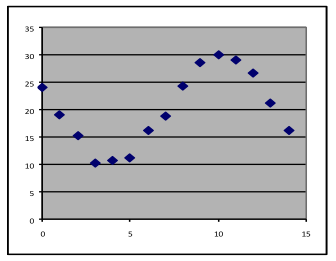
Example 7—for each graph below, is a linear, exponential, quadratic, or some other model appropriate?
|
[a]
|
[b]
|
[c]
|
|
[d]
|
[e]
|
[f]
|


Answers:
- Linear. While the graph is noisy, the trendline cannot be quadratic because it shows no sign of bending. It cannot be exponential since it isn’t showing any sign of bending to approach the x-axis. The best-fit straight line would leave only random noise, so it is the best model in this case.
- Quadratic. Since the graph changes direction from downward to upward as it goes from left to right, it cannot be linear or exponential. The graph is symmetric enough that the parabola that a quadratic model produces a trendline would be a good fit.
- A decaying exponential. The trendline is clearly not linear, and it approaches but does not cross the x-axis. A quadratic would also fit reasonably well (in that case the curve would go up again if extrapolated to the right), but an exponential would fit better and also is a simpler formula.
- A growth exponential. The data trend starts with a positive intercept and about doubles for each five steps. This is a faster increase than the best-fit quadratic, which would not quite follow the data
- Linear, although with significant noise. The best-fit line is about horizontal, so its slope is close to zero. A dataset that consists of repeated measurements of the same thing (as is often done to test the stability of the measurement process) would look similar to this.
- None of the listed models would work. This graph changes between upward and downward twice, while a quadratic can only change once and the other listed models cannot make that much of a direction change at all. As we will see in a later topic, there are other models to use in this case.
