107 H1.06: Example 4
Example 4: Write a mathematical model for the population of this city over the given period of time and use that to predict the population in 2010.
| Year | 1970 | 1980 | 1990 | 2000 |
| Pop’n (thousands) | 234 | 289.5 | 345 | 400.5 |
Solution:
1. What are the two variables? And what are their units?
Ans. Year and population. Year is in years and population is in thousands of people.
2. What will we predict? (Make it y.) What are some points?
Ans. We will predict population. So y = population. Year is the input variable. However, as we saw Example 3, it will be more convenient to have the input variable x = years since 1970. Then x is greater than or equal to zero. Obviously y must also be greater than or equal to zero.
1970 has pop’n of 234. So x = 0 and y = 234. Use the point (0, 234)
1980 has pop’n of 289.5. So x = 10 and y = 289.5. Use the point (10,289.5)
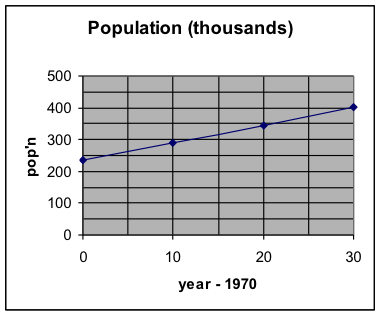
3. Is a linear model appropriate?
| year | year – 1970 | popn |
| 1970 | 0 | 234 |
| 1980 | 10 | 289.5 |
| 1990 | 20 | 345 |
| 2000 | 30 | 400.5 |

The graph clearly indicates that a linear model is appropriate for this population growth over this time period.
4. Slope: Find the slope: m = rise / run
Let (0,234) be the first point and (10,289.5) be the second point.
[latex]m=\frac{{{y}_{2}}-{{y}_{1}}}{{{x}_{2}}-{{x}_{1}}}=\frac{289.5-234}{10-0}=\frac{55.5}{10}=5.55[/latex]
Interpret the slope, using the units of the numbers in the problem:
(As x increases by 1, y increases by m.)
For each year that goes by, population will increase by 5.55 thousand people.
5. Write the formula for the linear relationship:
(Choose either point and use the point-slope form of the line. Then simplify it to the slope-intercept form of the line.)
Choose (0,234) for the point and use the slope of 5.55 that I just computed.
[latex]\begin{align}&y-{{y}_{0}}=m(x-{{x}_{0}})\\&y-234=5.55(x-0)\\&y-234=5.55x\\&y=5.55x+234\\\end{align}[/latex]
6. Interpret the y-intercept.
(The value of y is b when [latex]x=0[/latex].)
When [latex]x=0[/latex], that is, in 1970, the population is 234 thousand people.
7. Use the formula to make the requested prediction. Write the result in a sentence, with units.
For 2010, [latex]x=2010-1970=40[/latex].
[latex]\begin{align}&y=5.55x+234\\&y=5.55(40)+234\\&y=222+234\\&y=456\\\end{align}[/latex]
So, in 2010, the model predicts that the population will be 456 thousand people.
8. Sketch a graph from the original problem information, use it to estimate the answers to the prediction questions, and determine whether your answers from the algebraic formula are reasonable.
We take the same graph as before and extend it to the right so that we can estimate a population value for x = 40.

The value we see from the graph is approximately 450 thousand people. That is consistent with the value we obtained from the formula.
The prediction is reasonable.

